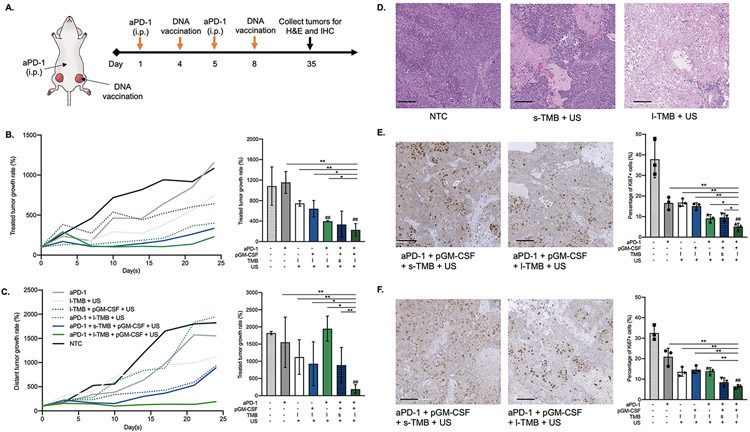
Figure 7.
A) Schematic illustration of the immunotherapy regimen: aPD-1 was injected on Day 1 and Day 5, and the mixture of pGM-CSF and TMB was co-injected into one tumor within the bilateral tumor model in mice, followed by ultrasound treatment on Day 4 and Day 8. Tumor growth and comparison of B) treated and C) distant tumors on Day 25. D) H&E staining in NTC, s-TMB + US and l-TMB + US treated tumor samples. IHC staining of Ki67 in E) treated and F) distant tumors. (Scale bars: 100 μm). *P < 0.05, **P < 0.01 and ##P < 0.01 vs. NTC. All data are plotted as mean ± SD.

