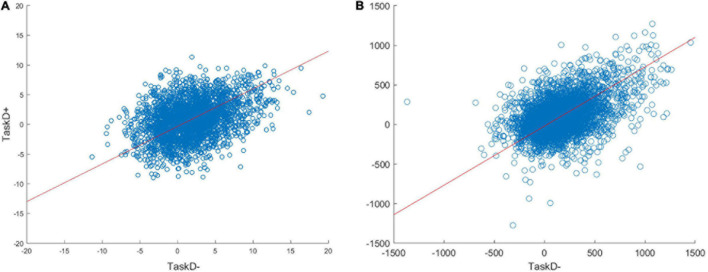
FIGURE 2.
Scatterplots of the voxel responses (contrast estimates from the GLM) to TaskD+ against TaskD– comparing the simulated data with a = 3 (A) against the real 7T data (B). The scatterplots look similar, suggesting that the simulation is capturing the behavior of real voxels. Note that the methods we evaluate are invariant to the absolute scale of the response, so these do not require matching; rather, we are only interested in the relation of the values across task types, i.e., the gradient of the best fit line (indicated by the red line), which is comparable across simulated (0.65) and real (0.72) data.

