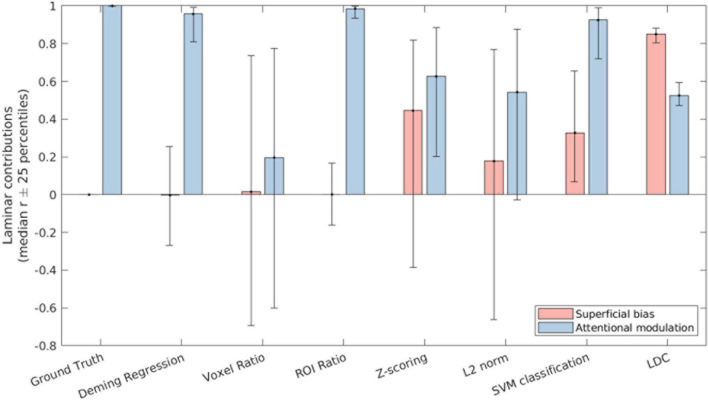
FIGURE 4.
The contribution of superficial bias (pink bars) and attentional modulation (blue bars) to the laminar profile as recovered by the respective attentional metrics. The bars indicate the median correlation over iterations of the simulation, while the error bars indicate the 25th and 75th percentile values.

