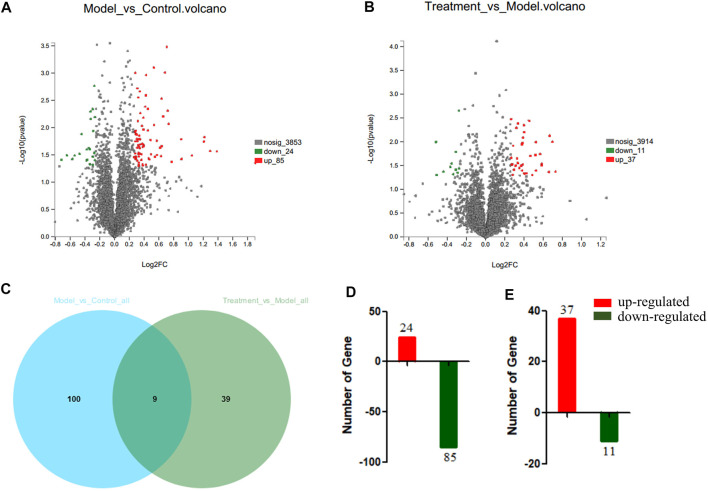
FIGURE 6.
The differentially abundant proteins (DEPs) in serum between Model:Control and Treatment: Model. (A) Volcano Plots of DEPs of Model:Control. (B) Volcano Plots of DEPs of Treatment:Model. (C) Venn-diagram showing the overlap of all DEPs. (D) DEPs involved in Model:Control. (E) DEPs involved in Treatment:Model. Red or Green represents the numbers of upregulated and downregulated proteins, respectively.

