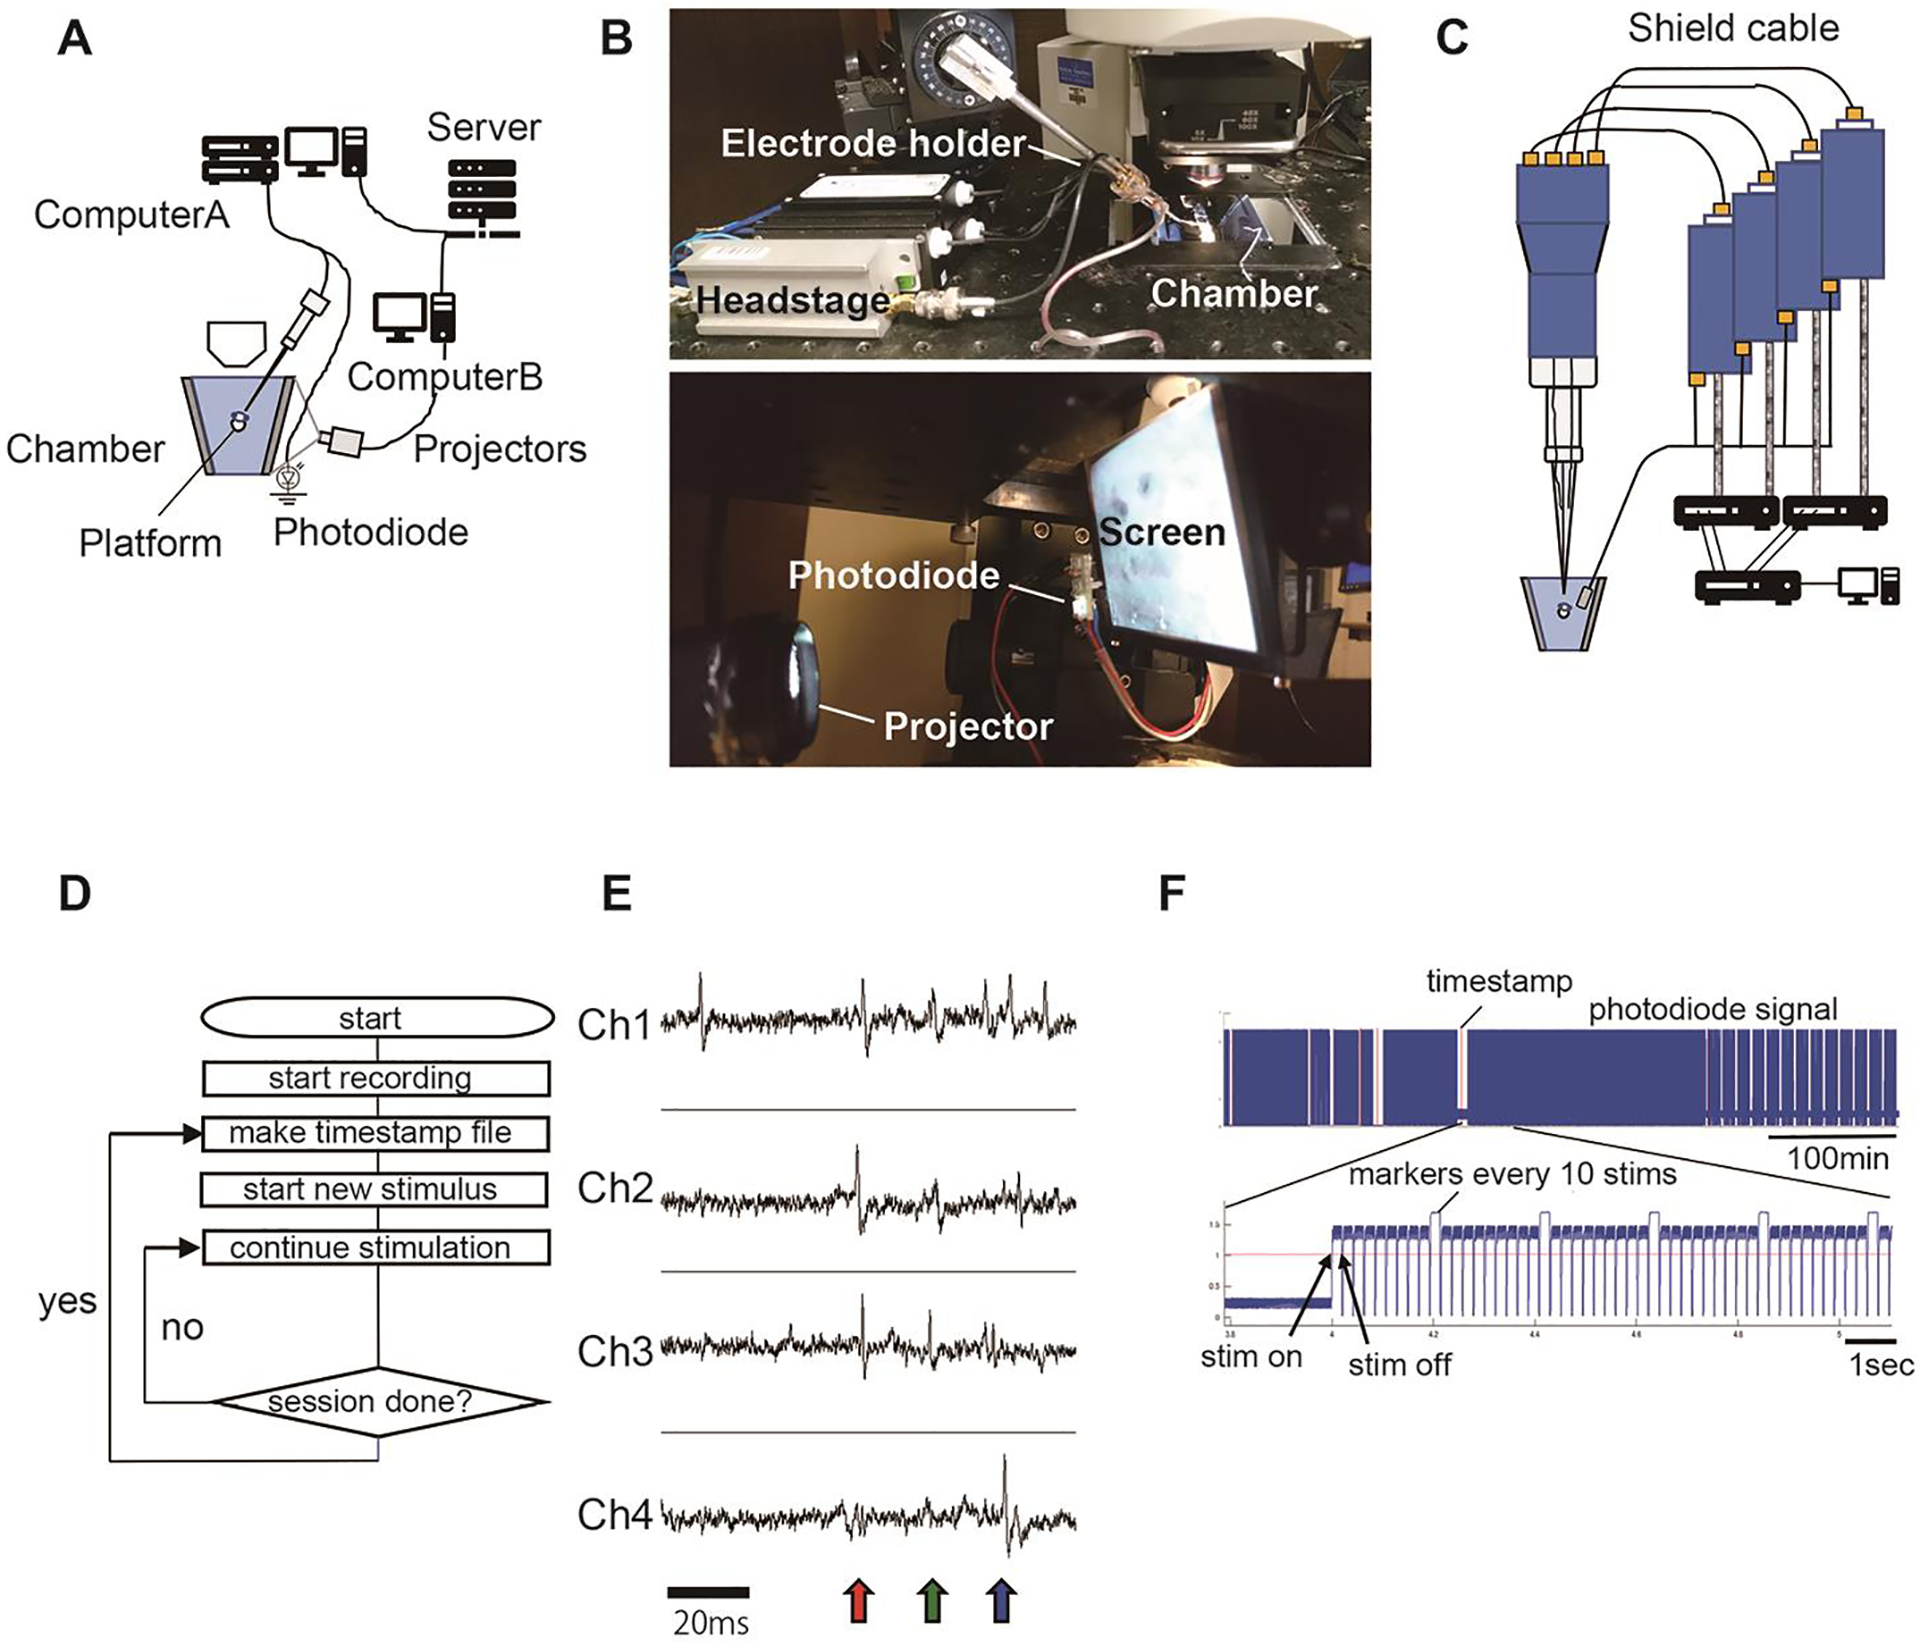
Figure 2.

A. Diagram of setup. Tetrode data are recorded in computer A. A back-projection screen and a platform to hold the animal are attached to a recording chamber. Images are generated in computer B and projected onto the back-projection screen. Stimulus timing is monitored by a photodiode. B. Top: Picture of the mounted electrode and headstage on the manipulator. Bottom: Picture of the miniprojector, photodiode and screen on the side of the recording chamber. C. Wiring of the four-channel glass electrode with the headstage assembly and amplifier (MultiClamp 700A/B). Bottom: Picture of the recording chamber and the projector. The photodiode is placed to the left of the screen. D. A flow chart of continuous recording. Neural activity is recorded continuously. Temporal boundaries of recording sessions are marked with a timestamp file generated by the image presentation computer (computer B). E. Spike waveforms recorded by individual channels. Spike signals from the same cells are detected by multiple channels (colored arrows). F. An example of the photodiode signal. The red lines identify session start times marked by the timestamp file. Timing of each stimulus is identified by the rising edge of the photodiode signal.
