Figure 6.
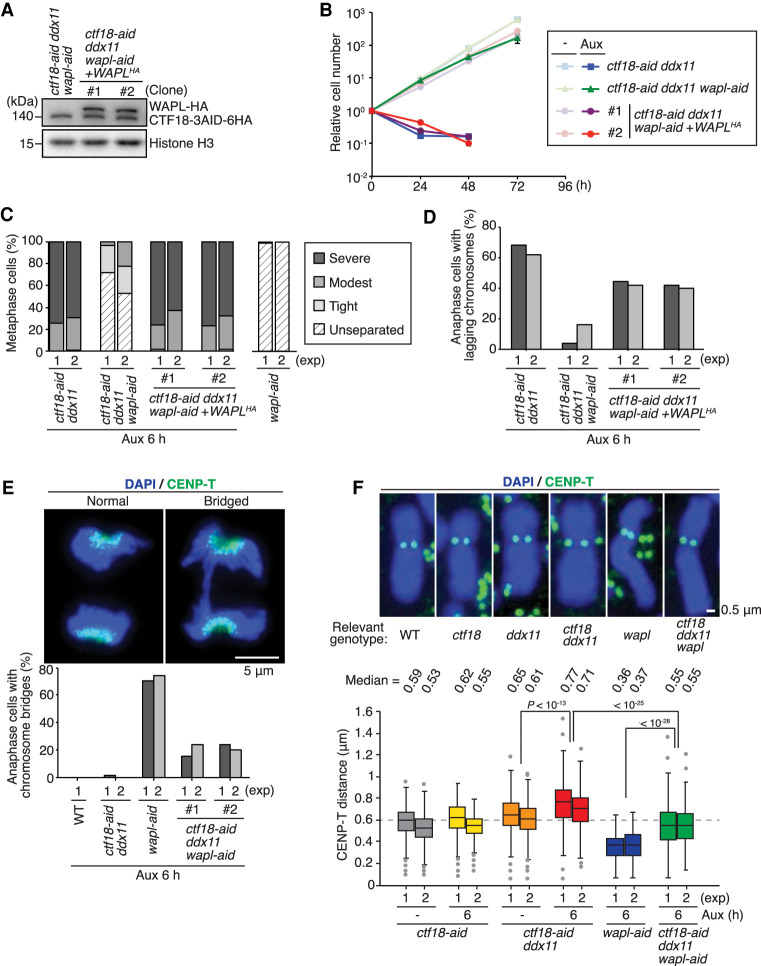
WAPL and DDX11-CTF18 have opposite effects on mitotic chromosome structure and sister centromere proximity. (A) Expression of complemented WAPL-HA was monitored by Western blotting as in Figure 1A. (B) Growth curves of cells of indicated genotypes with or without auxin treatment as in Figure 2A. (C) Metaphase chromosomes were analyzed for sister chromatid cohesion as in Figure 5C. (D) Frequency of lagging chromosomes at anaphase was measured as in Figure 5B. (E) Anaphase cells with bridged chromosomes were scored. At least 50 cells for the anaphase cells were analyzed. Auxin was added 6 h before cell collection. (F) Sister centromere distance was measured for the cells of indicated genotypes. CENP-T was used to mark centromeres, and the distance between paired CENP-T signals was measured for at least 200 of chromosomes 1 and 2. (Middle line) Median, (box) 25th and 75th percentiles, (bars) 5th and 95th percentiles. P-values were calculated by Student's t-test and plotted.

