Figure 3.
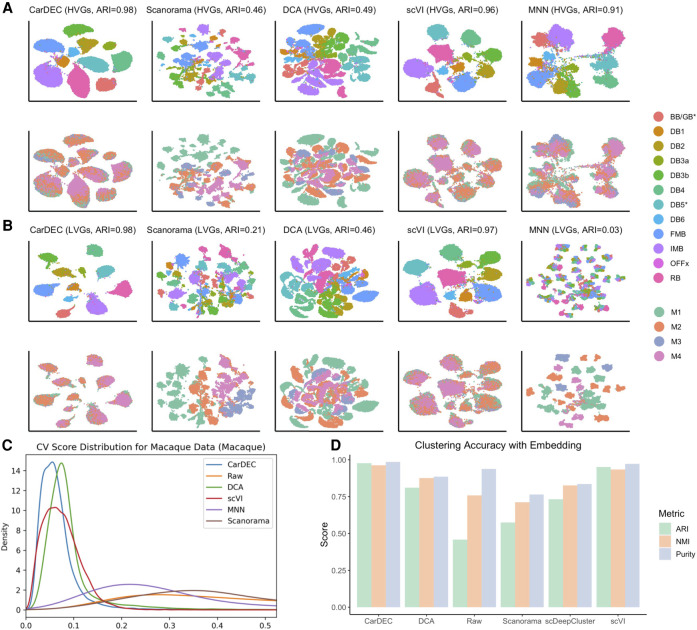
Comparison of different methods on the macaque retina data set. (A) UMAP embedding computed from the denoised HVG counts for each method. The top row was colored by cell type; the bottom row was colored by Macaque ID. Cells were also clustered with Louvain's algorithm. (B) UMAP embedding computed from the denoised LVG counts for each method. Figure legends are the same as those in A. (C) Density plot of genewise CV among batch centroids. Density plots are provided for HVGs and LVGs separately. Centroids computed with sample ID as batch definition. (D) Clustering accuracy metrics were obtained using the embedding-based methods to cluster the data, rather than running Louvain on the full gene expression space. Results for “Raw” were obtained by using Louvain's algorithm on the original HVG counts and are provided as a baseline to which embedding-based clustering results may be compared.

