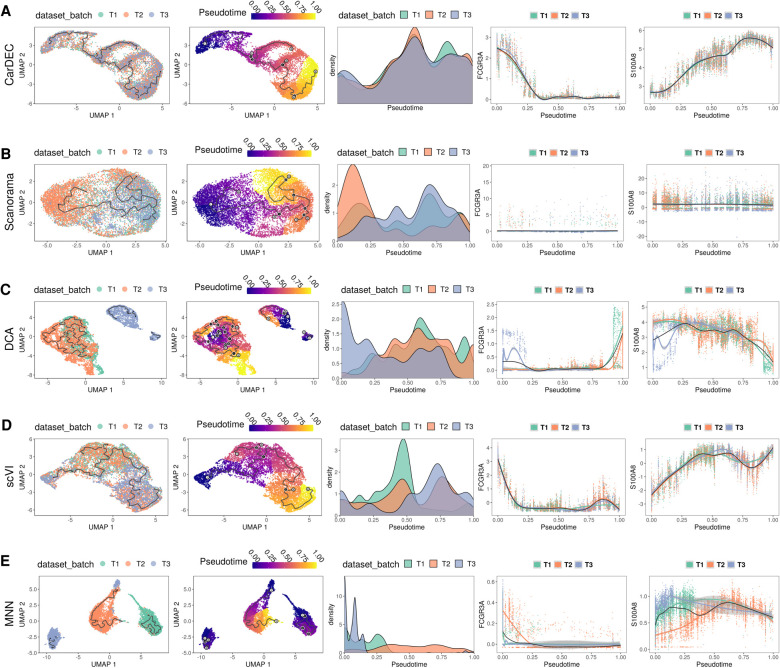
Figure 5.
Comparison of different methods for pseudotime analysis in the human monocyte data. The analysis is performed on monocytes derived from three technical replicates from the same subject. For each method, the full data set was denoised/batch corrected and then fed to Monocle 3 for pseudotime analysis. We show the UMAP embedding colored by batch (column 1) and estimated pseudotime (column 2). We also visualize the kernel density distribution of pseudotime by batch (column 3) and plot the distributions of marker genes FCGR3A and S100A8 against pseudotime (columns 4 and 5, respectively). (A) Pseudotime analysis when using denoised/batch-corrected gene expression matrix from CarDEC as input. (B) Pseudotime analysis when using batch-corrected gene expression matrix from Scanorama as input. (C) Pseudotime analysis when using denoised gene expression matrix from DCA but with Combat post hoc batch correction as input. (D) Pseudotime analysis when using denoised/batch-corrected gene expression matrix from scVI as input. (E) Pseudotime analysis when using batch-corrected gene expression matrix from MNN as input.

