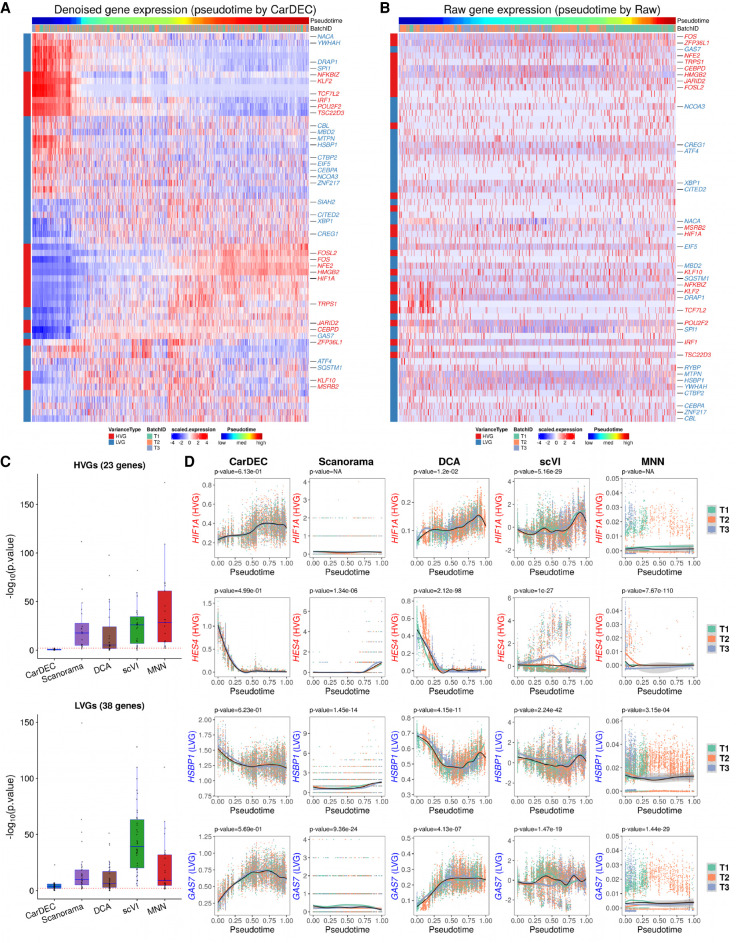
Figure 6.
Comparison of different methods for differential expression analysis of transcription factors in the human monocyte data. (A) Heat map of scaled gene expression for CarDEC. Pseudotime was inferred based on embedding obtained from CarDEC using Monocle 3. (B) Heat map of scaled raw UMI counts. Pseudotime was inferred based on embedding obtained from the scaled raw UMI counts using Monocle 3. (C) P-values obtained from differential expression analysis among the three batches over pseudotime. For each method, the pseudotime was inferred based on embedding obtained from the corresponding method. The red dotted line corresponds to P-value = 0.01. The top panel is for the 23 HVG TFs, and the bottom panel is for the 38 LVG TFs. (D) Denoised and batch-corrected gene expression for CarDEC, batch-corrected gene expression for Scanorama, denoised gene expression for DCA with Combat post hoc batch correction, denoised and batch-corrected gene expression for scVI, and batch-corrected gene expression for MNN over pseudotime for four selected TFs: HIF1A, HES4, HSBP1, and GAS7. For each method, the pseudotime was inferred based on embedding from the corresponding method.

