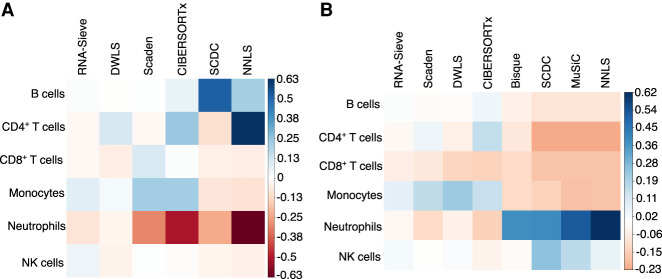
Figure 3.
Deconvolution biases for PBMC data with known ground-truth proportions. Average differences between inferred and true proportions were computed within each cell type across the 12 bulk samples present in each scenario. Consistent overestimation of a cell type's abundance results in darker blue squares, whereas red corresponds to chronic underestimation. Methods are ordered left to right by overall performance. (A) Deconvolution using Newman et al. (2019) data. (B) Deconvolution using Monaco et al. (2019) data.

