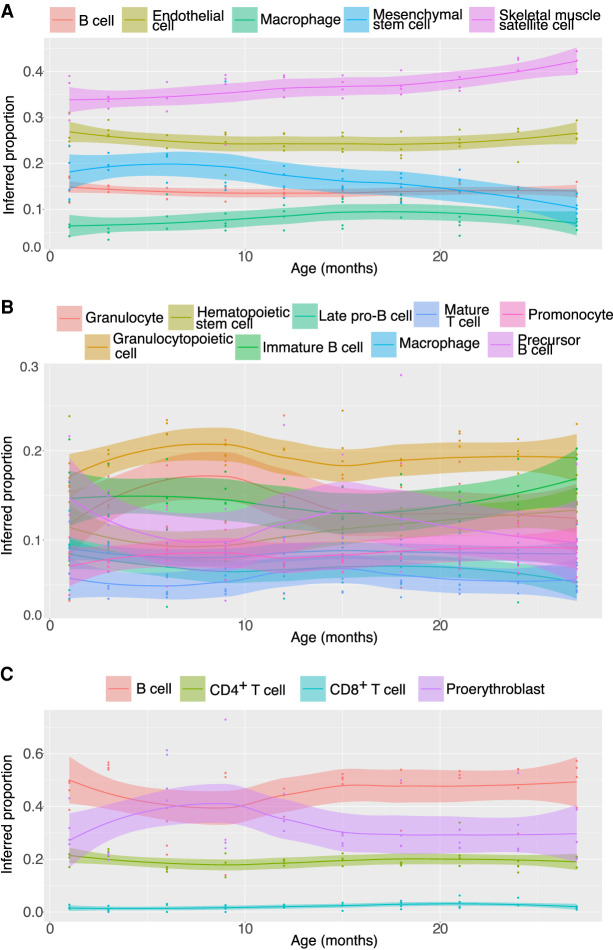
Figure 4.
Deconvolution results for real bulks from the Tabula Muris Senis. Roughly 40 real bulk samples across 10 ages were deconvolved using RNA-Sieve in each of the limb muscle (A), bone marrow (B), and spleen (C). In all cases, Smart-seq2 data were used as the reference. Each point represents the inferred proportion for a given cell type in a bulk sample. Lines display the smoothed trend of proportions as a function of age, with uncertainty shown by the shaded intervals.

