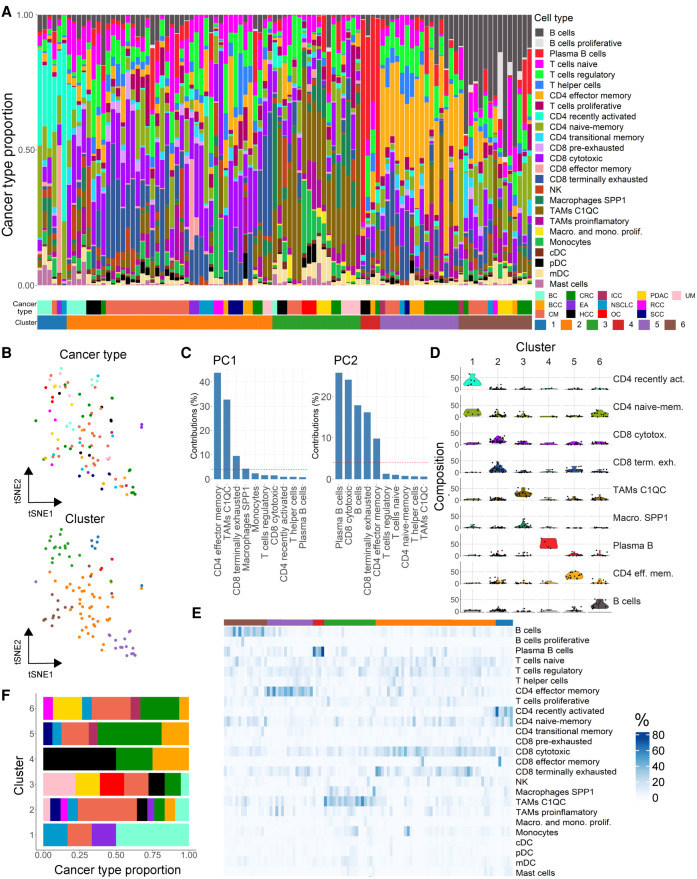
Figure 2.
Patient stratification based on the tumor immune cell composition. (A) Cell type composition of patients colored by cell type/state frequencies. Patients are clustered (C1–6) into groups of similar cell type composition. Cancer and cluster identities are indicated below. (B) Dimensionality reduction representation (t-SNE distribution) of cell type frequencies in cancer patients colored by cancer type (top) and cluster identity (bottom). (C) Variance contribution to the two first principal components (PCs) of the top variable cell types. (D) Frequencies (% total cells) of cell types representative for cluster 1–6. (E) Heat map representation of cell type frequencies within each cluster. (F) Cancer type contribution to the six immune clusters; color code as cancer types in A.

