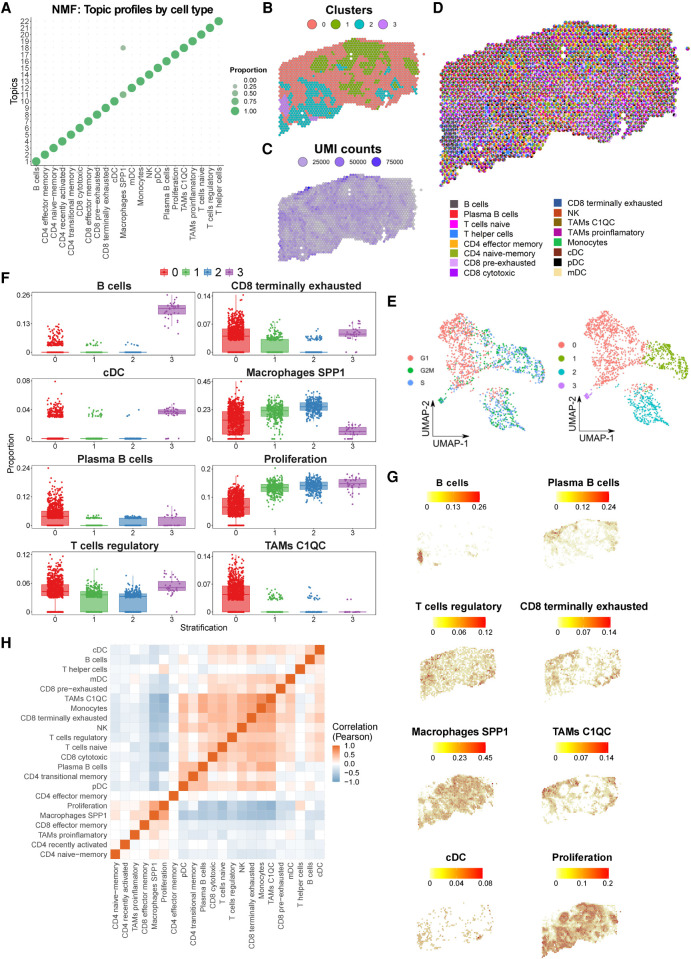
Figure 5.
Spatial mapping of the reference immune cell types using ST oropharyngeal squamous cell carcinoma (SCC) sections. (A) Cell type–specific topic profiles presenting a high topic/cell type specificity. (B) ST profiled section of a SCC primary tumor. Tissue stratification according to unsupervised clustering. (C) The number of unique molecular identifiers (UMI) recovered from each spot indicate the areas transcriptionally most active. (D) Pie chart representation showing proportions (per ST spot) of SPOTlight-predicted immune cells based on the single-cell immune reference atlas. To visualize spatially variable cell types, only immune cell types present in <75% of the spots are displayed. (E) UMAP embedding of ST spots presenting the cell cycle phase (left) and cluster identity (right) for each spot. (F) Box plots displaying significant differences in cell type proportion of clusters (ANOVA test). (G) Location and proportion of significantly differentially located cell types in the SCC section. (H) Clustered correlation matrix between the predicted cell type proportions identifying colocalization (red) and exclusive (blue) immune distribution patterns.

