Figure 6.
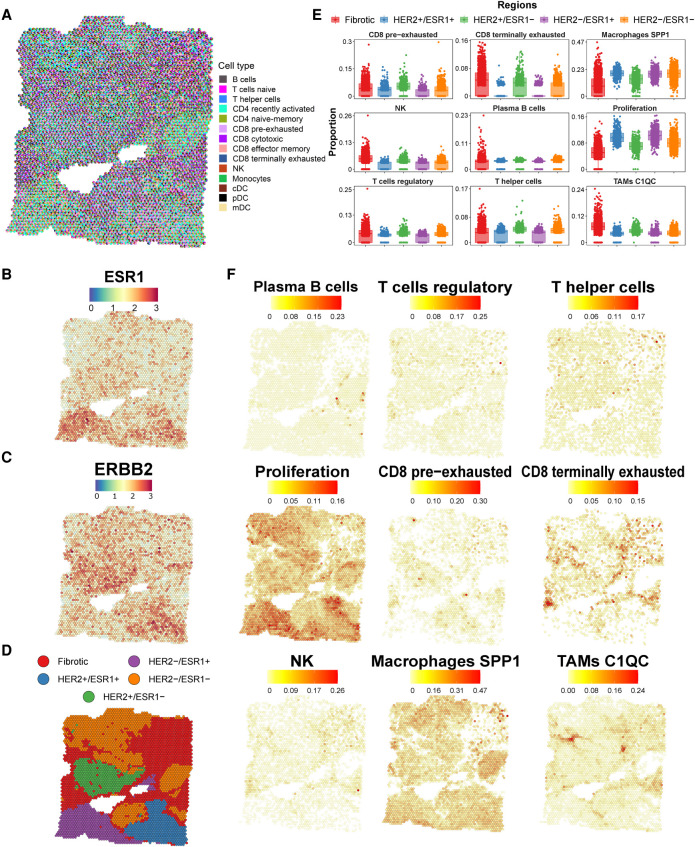
Tumor immune reference mapping ST section from a ductal breast carcinoma. (A) Pie chart representation showing proportions (per ST spot) of SPOTlight-predicted immune cells based on the single-cell immune reference atlas. To visualize spatially variable cell types, only immune cell types present in <75% of the spots are displayed. (B,C) Estrogen receptor 1 (ESR1, B) and erb-b2 receptor tyrosine kinase 2 (ERBB2, also known as HER2, C) gene expression levels on the ST section, indicating profound regionality of the expression. (D) Tissue stratification and labeling according to unsupervised clustering. (E) Box plots of significantly differentially localized cell type proportions between the clusters (ANOVA test). Differences between tumor areas (i.e., HER2+ and ESR1+) are observed, suggesting differential tumor microenvironments of the tumor subclones. (F) Location and proportion of immune cell types with local enrichment.

