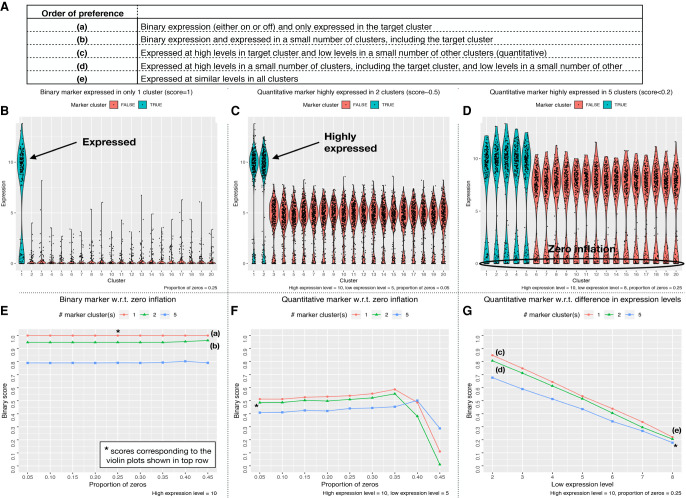
Figure 2.
Performance testing of Binary Expression Score. Gene expression data were simulated as described in the Methods section for different expression scenarios. (A) Possible marker gene expression patterns were ranked by order of preference. Panels B–D show violin plots for three different expression scenarios: (B) binary expression only in the target cluster; (C) quantitative expression with high expression in the target cluster and one other cluster and large differences in expression in the other off-target clusters; and (D) quantitative expression with high expression in the target cluster and four other clusters, small differences in expression in the other off-target clusters, and higher levels of zero inflation. Panels E–G show line graphs of the full range of tested simulations from three defined test cases: one cluster with high expression of the marker gene (red); two clusters with high expression of the marker gene (green); and five clusters with high expression of the marker gene (blue). (E) Proportion of zeros was increased while maintaining off-target expression at zero. (F) Off-target clusters were given moderate levels of expression while the proportion of zeros was increased. (G) Expression levels were varied in all off-target clusters from low (2) to high expression (8).

