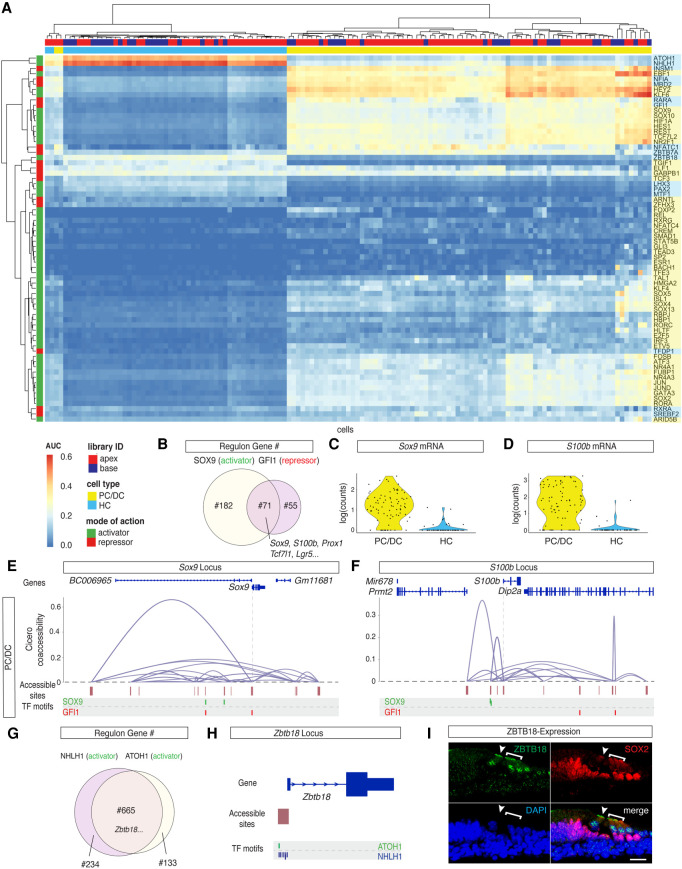
Figure 3.
TFs controlling HC and PC/DC differentiation. (A) AUC enrichment matrix with hierarchical clustering at single-cell resolution revealed the regulon activities during differentiation of HCs and PC/DCs. A regulon summarizes putative downstream target genes as a group of the respective TF. The activity of the regulon is color-coded from blue (depletion) to red (enrichment). Hierarchical clustering reveals similarities between individual cells (x-axis) and between different regulons (y-axis). Color bars on the top and to the side of the heat map indicate library ID, cell type, mode of action, and cell type specificity. (B) Venn diagram of the number of overlapped downstream target genes between the SOX9 regulon and GFI1 regulon. (C,D) Violin plots of Sox9 (C) and S100b (D) expression level. The two genes are representatives of overlapping downstream target genes between the SOX9 and GFI1 regulons. (E,F) Coaccessibility analysis of Sox9 and S100b loci in the PC/DC cluster using Cicero. (E) In PC/DCs, Sox9 TSS is directly and indirectly connected to the accessible sites. They correspond to predicted regulatory elements that contain putative TF binding sites for SOX9 and GFI1, as determined by FIMO motif scanning. (First row) Genome annotation from UCSC Known Genes. (Second row) Coaccessibility plot connects predicted regulatory elements with the TSS. (Third row) Accessible regions aligned with the locus. (Forth row) Putative TF binding sites of SOX9 and GFI1 motifs relative to the accessible regions. TSS position is indicated with a dashed line. (F) Analogous data representation for the S100b locus. (G) Overlapping downstream target genes between known HC transcriptional activators ATOH1 and NHLH1. (H) Zbtb18 is a shared target gene between the ATOH1 and NHLH1 regulons with accessible TF binding sites for both TFs at the TSS in HCs. (I) Immunostaining of ZBTB18 protein expression in IHCs and OHCs in cryosections of the organ of Corti (P2). Arrowhead pointing at the IHC. Bracket delineates OHC location. Scale bar, 20 µm.

