Figure 4.

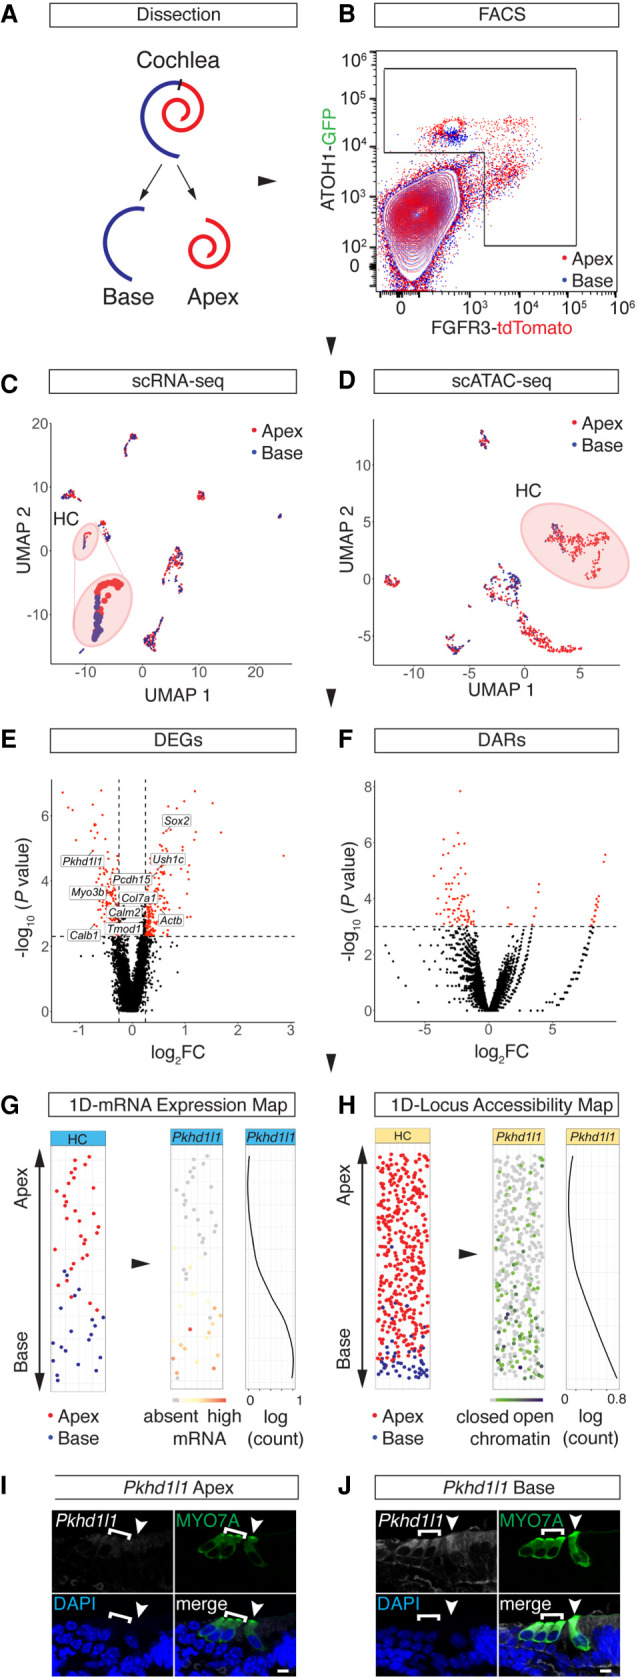
Spatial reconstruction of HC origins along the longitudinal axis. (A) Schematic representation of the sampling strategy used in this study. Color code is as follows: apex, red; base, blue. (B) FACS plot and gating strategy to isolate GFP- and tdTomato-expressing cells. Color code identifies compartmental identities (color code same as in A). (C,D) UMAP projections of all cells analyzed in the scRNA-seq (C) and scATAC-seq (D) experiments with color code for library ID (color code as in A and B). HC populations are highlighted with a circle and are magnified for better visibility in C. Dots correspond to single cells. (E,F) Volcano plots of DEGs (E) and DARs (F) comparing apical and basal compartments. scRNA-seq cutoff: P < 0.005 and absolute value of log2FC > 0.25. scATAC-seq cutoff: P < 0.001. (G,H) 1D spatial reconstruction of single-cell transcript expression levels and chromatin accessibilities. (G) 1D HC expression map. (Left) 1D PCA based on the DEGs shown in E. y-Axis resolves predicted apex (top) to base (bottom) axis. Data points are randomly spread along x-axis for better visibility. Dots correspond to single cells. Color code depicts library ID (same as in A–D). (Middle) Gene expression level of Pkhd1l1 projected onto the 1D expression map. (Right) Pkhd1l1 expression fitted into a regression line. y-Axis corresponds to the apex-to-base axis; x-axis, to expression level shown in log counts. (H) Analogous data representation as in G, showing 1D accessibility map with library ID and Pkhd1l1 accessibility projected. (I,J) RNAscope staining of Pkhd1l1 transcript comparing HCs of apical (I) and basal (J) origin. HCs were counter-stained with anti-MYO7A and DAPI nuclear stain. IHC (arrowhead) and OHC (bracket) staining using identical imaging settings. Scale bar, 10 µm.
