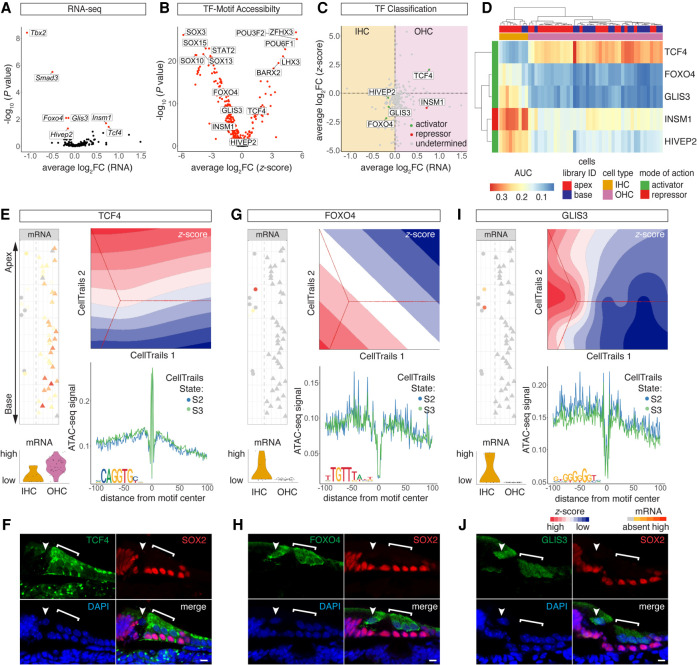
Figure 6.
TFs controlling IHC and OHC differentiation. (A) Volcano plot of differentially expressed TF genes (P-adjusted < 0.05) between IHCs and OHCs. (B) Volcano plot of differentially accessible TF motifs (P-adjusted < 0.05) comparing IHC and OHC clusters. (C) Dot plot of TF classification shown in average log2FC mRNA transcripts and z-scores. The differential expression between IHCs and OHCs is plotted on the x-axis, and differential accessibility is shown on the y-axis. Activators are classified in green, repressors in red, and undetermined TFs in gray. (D) AUC enrichment matrix of TF regulons contributing to IHC/OHC segregation. Color bars on the top and to the side of the heat map indicate library ID, cell type as determined based on DEGs, and mode of action. (E,G,I) Comparative analysis of selected TFs in terms of mRNA expression, motif accessibility, and footprints. Analogous data representation as in Figure 5, F and G. (E) OHC activator TCF4. (F) Anti-TCF4 staining localizes to OHC nuclei and cytoplasm. HCs are counter-stained with anti-MYO7A and DAPI nuclear stain. Arrowhead points at IHC nucleus; bracket highlights OHC region. Scale bar, 10 µm. (G) IHC activator FOXO4. (H) Anti-FOXO4 staining in IHC and OHC cytoplasm and nuclei. Counter-stain, scale bar, and labeling analogous to F. (I) IHC activator GLIS3. (J) Anti-GLIS3 in IHC and OHC cytoplasm and nuclei. Counter stain, scale bar, and labeling analogous to F.

