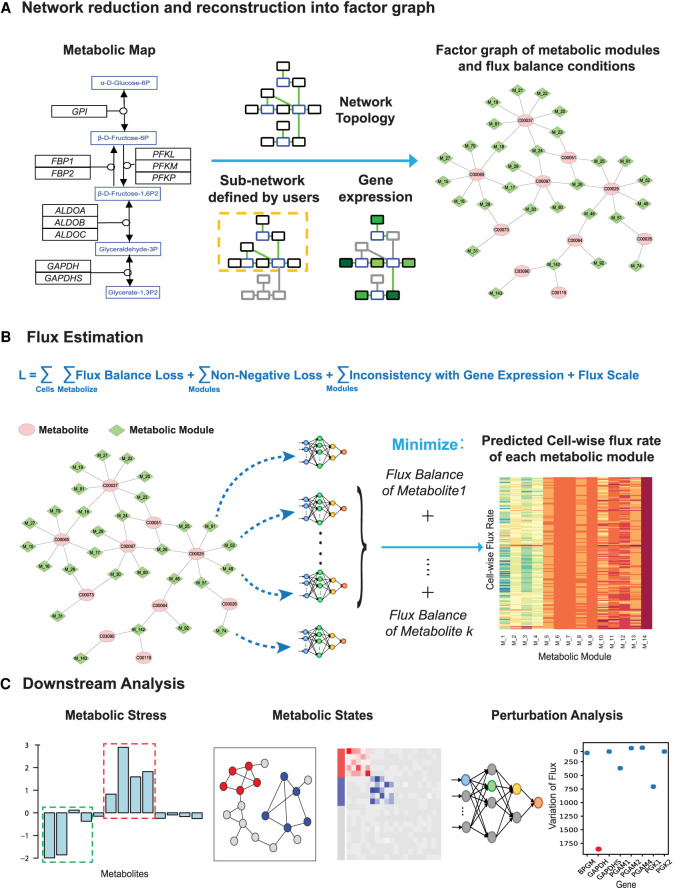
Figure 1.
The computational framework of scFEA. (A) Metabolic reduction and reconstruction. A metabolic map was reduced and reconstructed into a factor graph based on network topology, significantly non-zero gene expressions, and users’ input. (B) A novel graph neural network architecture–based prediction of the cell-wise fluxome. A loss function (L) composed by loss terms of flux balance, non-negative flux, coherence between predicted flux and gene expression, and constraint of flux scale, were used to estimate cell-wise metabolic flux from scRNA-seq data. See detailed models and formulations in Results and Methods. (C) Downstream analysis of scFEA is provided, including inference of metabolic stress, cell and module clusters of distinct metabolic states, and the genes of the top impact to the whole metabolic flux.

