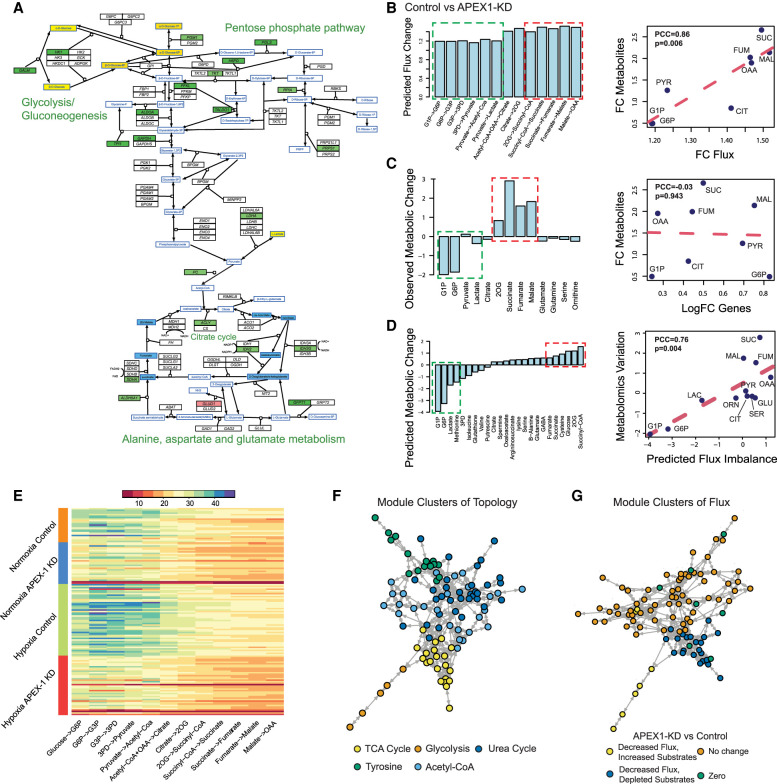
Figure 4.
Application of scFEA on matched scRNA-seq and metabolomics data of Pa03C cells. (A) Gene expression and metabolomic variations of the glycolysis, pentose phosphate, TCA cycle, glutamine, and aspartate metabolic pathways in APEX1-KD versus control under normoxia condition. Genes/metabolites are shown in rectangular boxes with black/blue borders, up-regulated/down-regulated genes are colored in red/green, increased and decreased metabolites are colored in yellow/blue, respectively. The darker color suggests a higher variation. (B) Predicted flux fold change (left, x-axis: metabolic module, y-axis: predicted flux change) in control versus APEX1-KD, and correlation between fold change of predicted flux and observed metabolite change (right, x-axis: fold change of predicted flux, y-axis: fold change of observed metabolite abundance, each data point is one metabolite). (PYR) pyruvate; (CIT) citrate; (FUM) fumarate; (SUC) succinate; (MAL) malate. (C) Observed metabolomic change (left, x-axis: metabolites, y-axis: abundance difference observed in the metabolomics data) in control versus APEX1-KD, and correlation between log fold change of gene expressions involved in each reaction and observed metabolomics change (right, x-axis: log fold change of the averaged expression of the genes involved in each reaction, y-axis: fold change of observed metabolites abundance observed in the metabolomics data, each data point is one metabolite). (D) Predicted metabolic stress (left, x-axis: metabolites, y-axis: predicted abundance difference) in control versus APEX1-KD and correlation between predicted metabolic stress and observed difference in metabolite abundance (right, x-axis: top scFEA-predicted imbalance of the influx/outflux of intermediate metabolites, y-axis: difference of observed metabolomic abundance, in control versus APEX1-KD, each data point is one metabolite: (LAC) lactate; (SER) serine; (GLU) glutamine; (ORN) ornithine. In B–D, all comparisons were made by comparing control versus APEX1-KD under normoxia. The fold change of metabolomic abundance is used in calculating the correlation in B–C and difference of metabolomic abundance is used in D. The green and red dashed blocks represents the accumulated (green) and depleted (red) metabolites in Control versus APEX1-KD. (E) Profile of the predicted fluxome of 13 glycolytic and TCA cycle modules. Here, each column represents the flux between two metabolites (shown on the x-axis) for all the cells of the four experimental conditions (shown on the y-axis). For two neighboring fluxes, the product of the reaction on the left is the substrate of the reaction on the right, and in a perfectly balanced flux condition, the two neighboring fluxes should be equal. (F) Clusters of metabolic modules inferred by using the network connectivity structure only. (G) Clusters of metabolic modules inferred by using the network topological structure (weight of 0.3) combined with the predicted fluxome (weight of 0.7).

