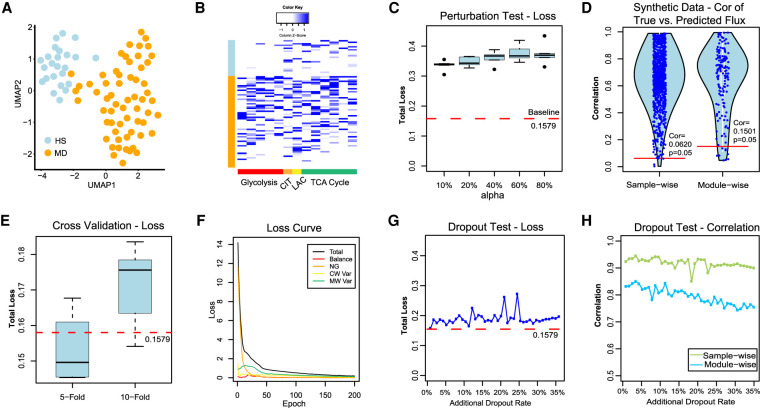
Figure 5.
Method validations on real-world and synthetic data sets. (A) UMAP-based clustering visualization of the GSE132581 PV-ADSC data, in which HS and MD stand for PV-ADSC of HS and more differentiation, respectively. (B) Distribution of predicted cell-wise flux of glycolytic and TCA cycle modules. Each row is one cell, and row side color bar represents HS and MD PV-ADSC by blue and orange, respectively. Each column is one module. The left five columns (red) are glycolytic modules from glucose to acetyl-CoA, the CIT column (orange) is the reaction from acetyl-CoA to Citrate, the LAC column (yellow) is the reaction from pyruvate to lactate, and the right six columns (green) are TCA cycle modules from citrate to oxaloacetic acid. (C) The total loss (y-axis) for cases in which different proportion (x-axis) of cell samples have randomly shuffled gene expressions of the pancreatic cancer cell line data. The baseline loss 0.1579 was computed using the original expression profile of all 166 cells. (D) The sample-wise and module-wise correlation (y-axis) between the true and predicted module flux in synthetic data-based method validation with multiple repetitions, in which Cor = 0.5775 (P = 0.05) and 0.5778 (P = 0.05) correspond to the sample-wise and module-wise correlation, respectively. (E) Total loss (y-axis) computed under 5-fold/10-fold cross-validation (x-axis) versus baseline loss. (F) Convergency of the total loss and four loss terms during the training of neural networks on the pancreatic cancer cell line data. (G) Total loss (y-axis) computed from the robustness test by adding 0%–35% artificial dropouts to the original data (50.22% zero rate) versus baseline loss. (H) Sample-wise and module-wise correlation (y-axis) of the module flux predicted from the data with 0%–35% additional artificial dropouts with the module flux predicted from the original data.

