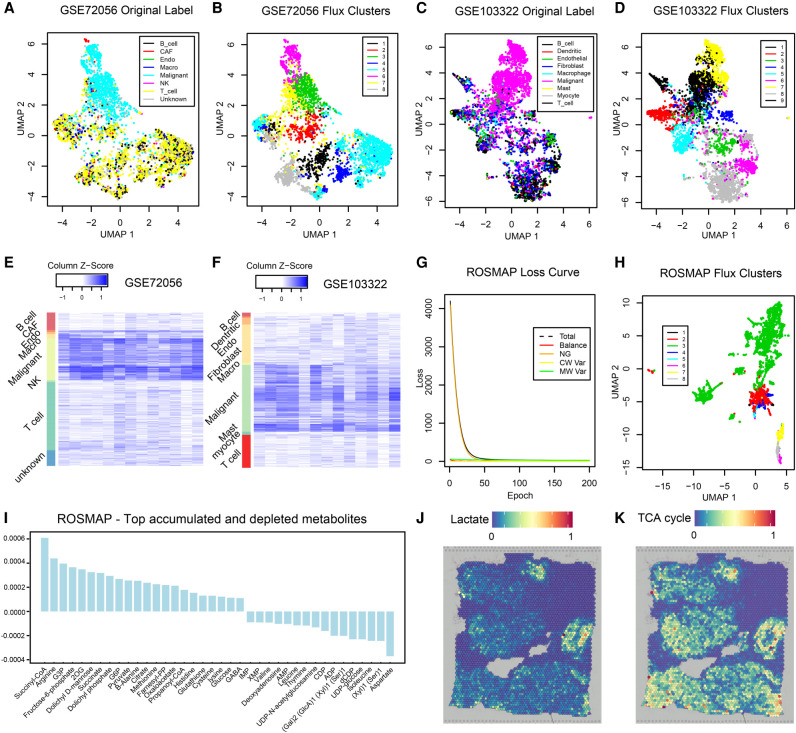
Figure 6.
Application on two tumor scRNA-seq data sets, ROSMAP, and one breast cancer spatial transcriptomics data set. (A) UMAP-based clustering visualization using predicted metabolic fluxes of the GSE72056 melanoma data; the cell label was provided in the original work (Tirosh et al. 2016). (B) UMAP-based clustering visualization using predicted metabolic fluxes of the GSE72056; k-means clustering was used for cell clustering. (C) UMAP-based clustering visualization using predicted metabolic fluxes of the GSE103322 head and neck cancer data; the cell label was provided in the original work (Puram et al. 2017). (D) UMAP-based clustering visualization using predicted metabolic fluxes of the GSE103322; k-means clustering was used for cell clustering. (E) Distribution of predicted cell-wise flux of glycolytic and TCA cycle modules of GSE72056 melanoma data. Each row is one cell, and row side color bar represents eight cell types. Each column is one module. The left five columns are glycolytic modules from glucose to acetyl-CoA, the sixth column is the reaction from acetyl-CoA to Citrate, the seventh column is the reaction from pyruvate to lactate, and the right-most six columns (columns 8–13) are TCA cycle modules from citrate to oxaloacetic acid. (F) Distribution of predicted cell-wise flux of glycolytic and TCA cycle modules of GSE103322 head and neck cancer data. Each row is one cell, and row side color bar represents nine cell types, respectively. The columns are the same as E. (G) UMAP-based clustering visualization using predicted metabolic fluxes of the ROSMAP data; k-means clustering was used for cell clustering. (H) Convergency curve of the total loss and four loss terms during the training of neural networks on the ROSMAP data. (I) Top accumulated and depleted metabolites predicted in the AD neuron cells in the ROSMAP data. The y-axis is metabolism stress level (or level of accumulation and depletion), where a positive value represents accumulation and a negative value represents depletion. The x-axis are metabolites in a decreasing order of the accumulation level. (J) scFEA-predicted flux rate of lactate product on the spatial breast cancer data. The color of each point represents the spatial-wise predicted lactate product rate. The spatial plot is overlaid on the tissue slice image. (K) scFEA-predicted flux rate of TCA cycle (citrate to 2OG) on the spatial breast cancer data.

