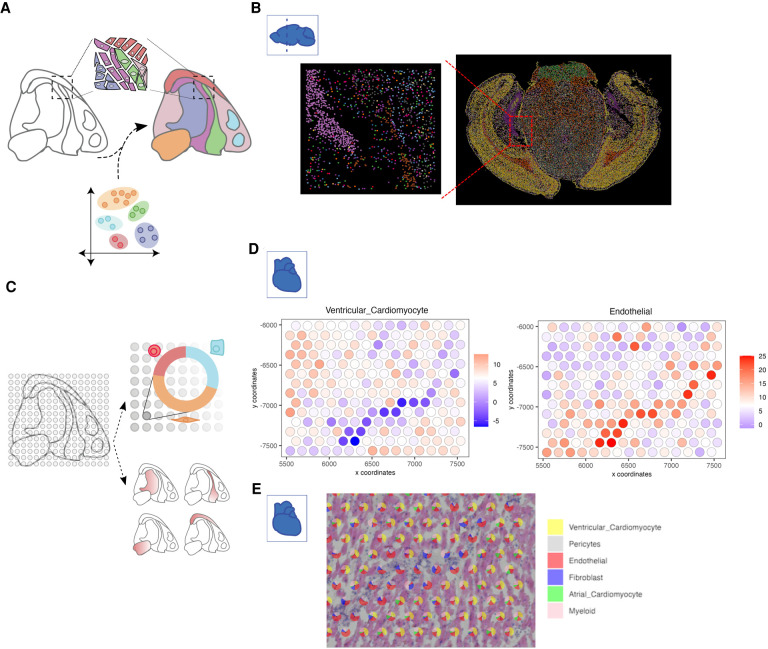
Figure 4.
Strategies for cell type identification with spatial transcriptomic data. (A) Spatial transcriptomics data at single-cell resolution can be directly used to identify cell types in an analogous manner to scRNA-seq. In addition, external scRNA-seq from matching tissue can also be integrated to increase the number of available features and aid in the identification of detected cell types. (B) An example of cell type annotation is shown on the MERFISH mouse coronal brain slice data set. Each single dot represents a single cell, and colors indicate different cell types identified through clustering. A zoomed-in subset shows the spatial cell type composition at a higher resolution. (C) Cell types in non-single-cell spatial transcriptomic data are identified through deconvolution approaches that make use of external information or through gene enrichment strategies using sets of known marker genes or scRNA-seq information. (D) Enrichment scores for two cell types within the human heart 10x Genomics Visium data set are overlaid on top of the spots within a region of interest. (E) Pie charts depict the proportion of identified cell types within each selected spot used in D.

