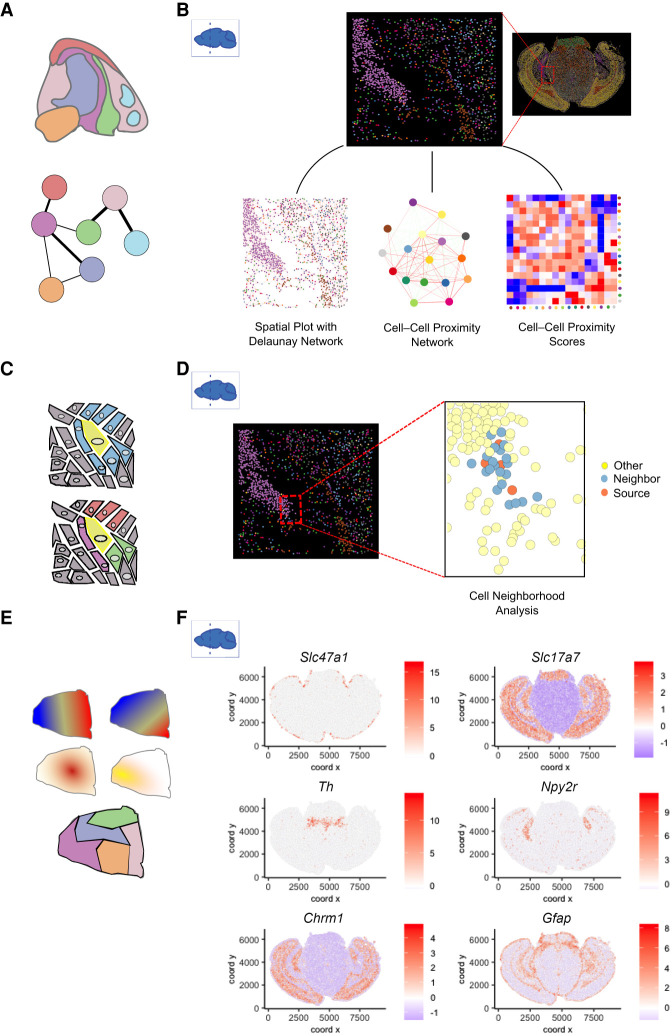
Figure 5.
Spatial pattern analyses. (A) Spatial distribution analysis of neighboring cell types. Network represents the likelihood of two cell types being found in close physical proximity to each other. (B) A subset of cells from the MERFISH mouse coronal brain slice data set shows the spatial network connectivity and cellular proximities between different cell types. (C) At the single-cell level, cellular niches can be identified based on a target cell (yellow) and its direct neighboring cells (blue). The composition and position of the neighboring cell types create a niche for the target cell (bottom). (D) Source and neighboring cells are depicted within a small subset of the MERFISH mouse coronal brain slice data set. (E) Patterns based on spatial gene expression information are based on single or multiple genes and are continuous (top) or discrete (bottom). (F) Individual genes with unique spatial coherent expression patterns in the MERFISH mouse brain coronal data set are shown on the right.

