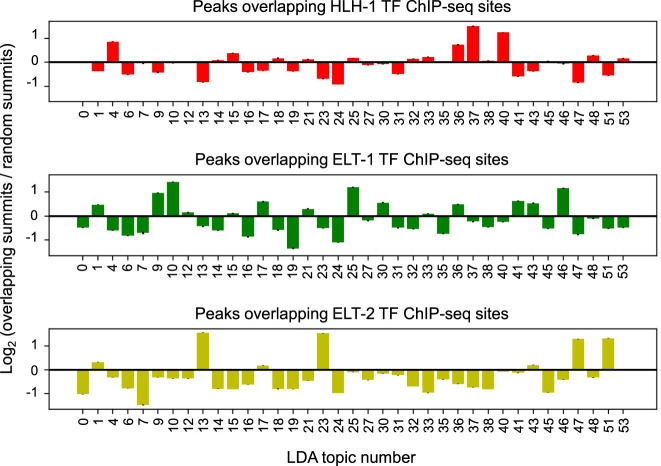
Figure 4.
Overlapping peaks important for each topic with ChIP-seq peaks collected from cell type–specific TFs suggests at least some topics represent tissue types. Peaks associated with each topic were overlapped with ChIP-seq peaks for three cell type–specific TFs: HLH-1, which is specific for muscle (top); ELT-1, which is specific for seam cells (middle); and ELT-2, which is specific for the intestine (bottom). Topic distributions for peaks with ChIP-seq site overlaps were compared with the topic distribution for randomly sampled peaks, and the results are plotted here as the log2 ratio of the overlap topic distribution to the random topic distribution. Error bars, 95% confidence interval for 100 random samples.

