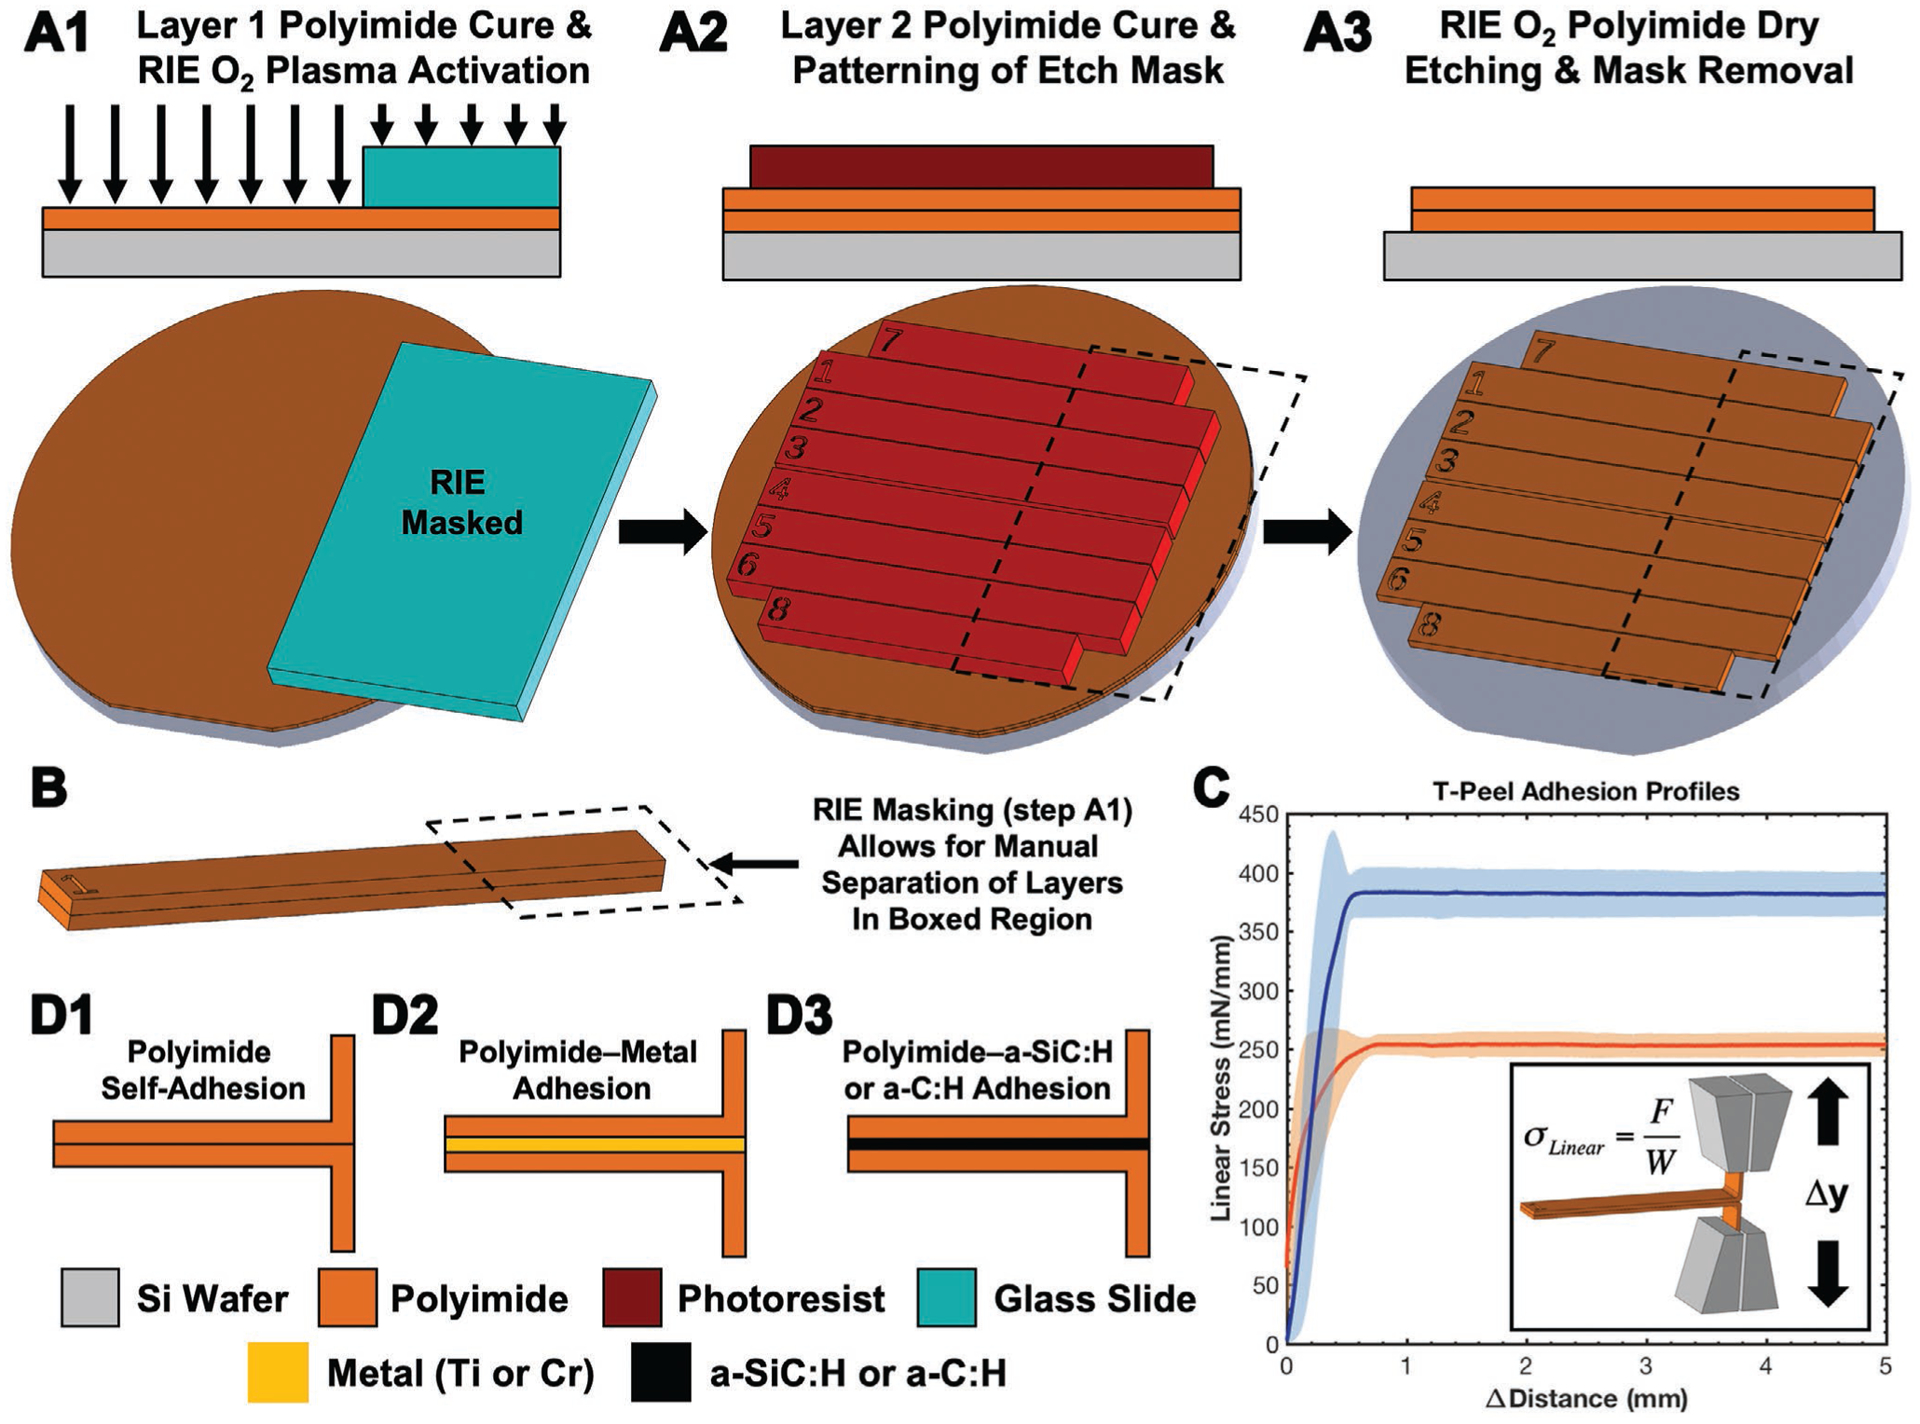
Figure 3.

Overview of the fabrication and testing of the T-peel test structures made from two layers of polyimide. A) Wafer-level fabrication process flow highlighting area masked during RIE by a glass slide. B) Highlighted details of an individual T-peel coupon, including the portion that can be peeled apart in order to be secured into a load frame for testing. C) Typical linear stress–distance curves of two sample populations with distinct maximum linear stress values and an inset schematic of the T-peel load grips. Data points represent the arithmetic average (± standard deviation error envelopes). D) Summary of T-peel test structures fabricated to isolate adhesion strength of different material interfaces.
