Figure 6.

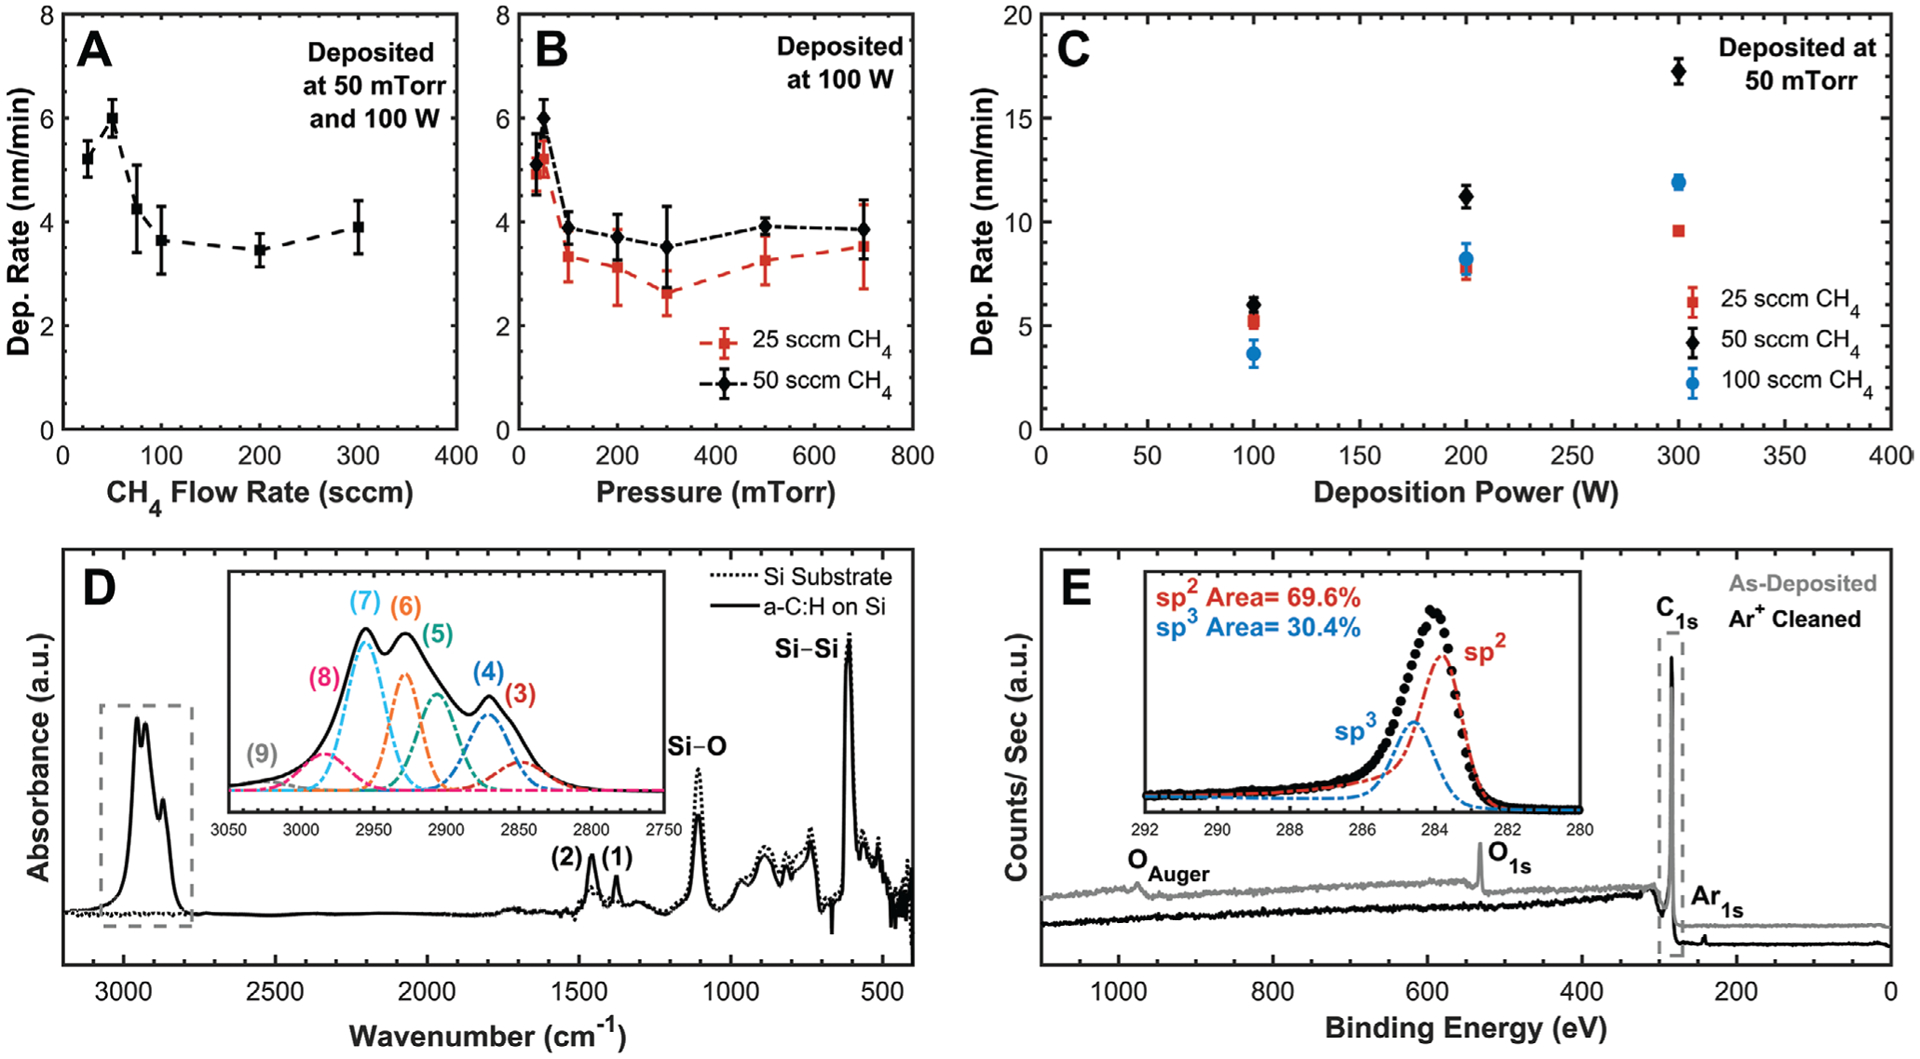
Summary of a-C:H deposition development and resultant film properties. One-way DOEs at 100 °C showing the influencing effect of deposition A) flow rate, B) pressure, and C) power. Deposition rate and surface coverage were maximized at 50 sccm CH4 and 50 mTorr with a linear increase with deposition power. Data points represent the arithmetic average with error bars representing one standard deviation, n = 3, N = 5, and dashed lines are simply to aid visualization. D) Transmission FTIR spectra of a-C:H film with included inset of the C—H stretching vibration region (boxed) showing a dominant sp3 character. Si—Si and Si—O peaks are from the Si wafer substrate, and a-C:H peak fitted IDs are included in Table 4. E) XPS survey spectra of a-C:H with included inset of the peak fitted C1s photoemission envelope from Ar+ cleaned surface (boxed) with no detectable oxygen. Spectra were peak-shift corrected to 284 eV C—C to account for charging, and spectra are shifted along the Y-axis to allow for comparison.
