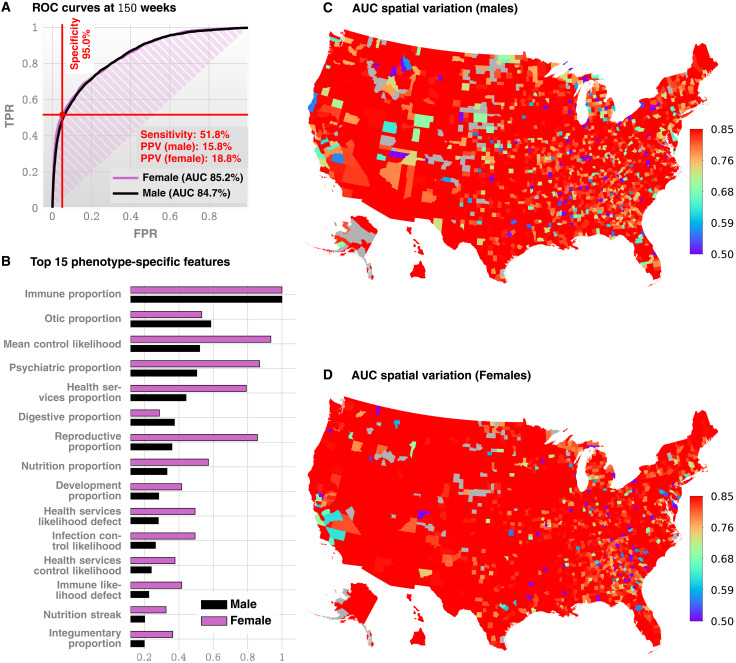
Fig. 1. Standalone predictive performance of ACoR.
(A) Receiver operating characteristic (ROC) curves for males and females (Truven data shown, UCM is similar, see Fig. 2A). (B) Feature importance inferred by our prediction pipeline. The detailed description of the features is given in Table 2. The most important feature is related to immunologic disorders, and we note that in addition to features related to individual disease categories, we also have the mean control likelihood (rank 3), which may be interpreted as the average likelihood of the diagnostic patterns corresponding to the control category as opposed to the positive category. (C and D) Spatial variation in the achieved predictive performance at 150 weeks, measured by AUC, for males and females, respectively. Gray areas lack data on either positive or negative cases. These county-specific AUC plots show that the performance of the algorithm has relatively weak geospatial dependence, which is important in the light of the current uneven distribution of diagnostic resources. Not all counties have nonzero number of ASD patients; high performance in those counties reflects a small number of false positives with zero false negatives.

