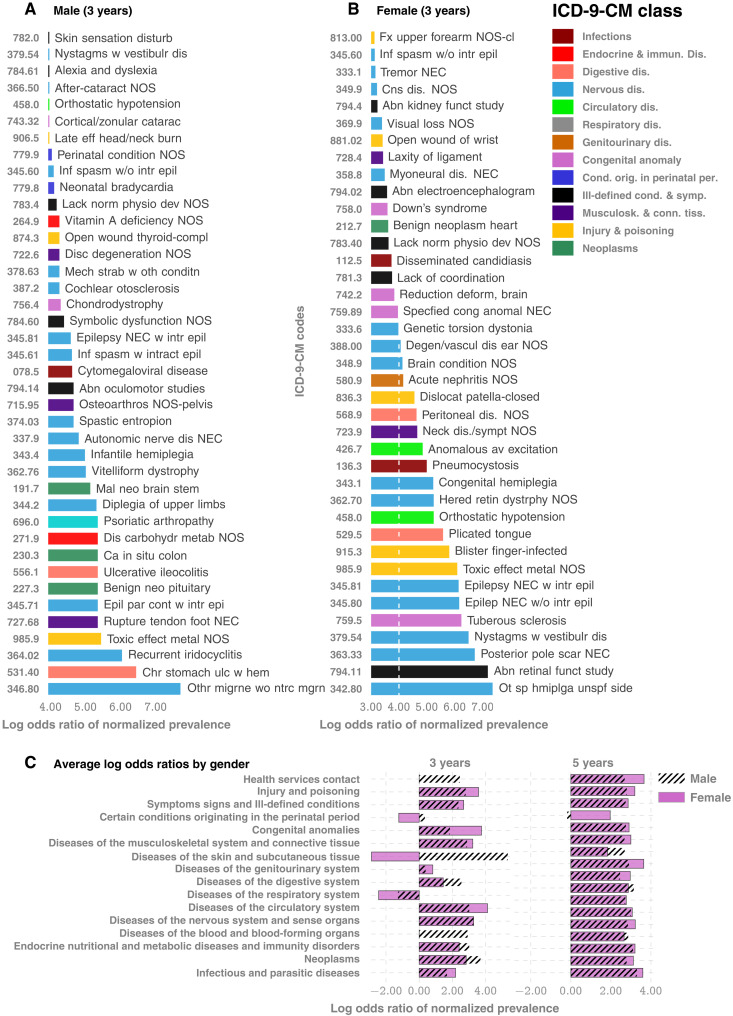
Fig. 4. Comorbidity patterns.
(A and B) Difference in occurrence frequencies of diagnostic codes between true-positive and true-negative predictions. The dashed line in (B) shows the abscissa lower cutoff in (A), illustrating the lower prevalence of codes in females. (C) Log-odds ratios for ICD-9-CM disease categories at different ages. The negative associations disappear when we consider older children, consistent with the literature that lacks studies on very young cohorts.

