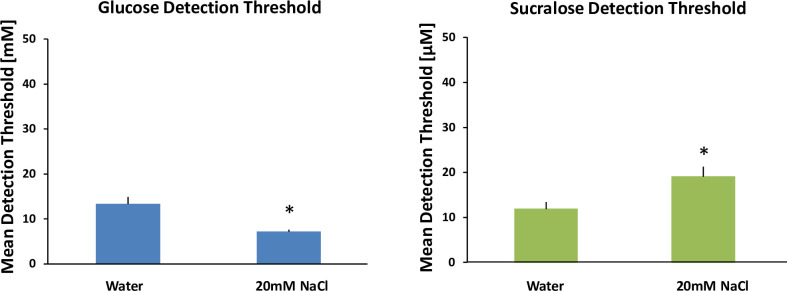
Fig 2. Mean glucose [mM] and sucralose [μM] detection thresholds with added NaCl.
There are two bar charts in Fig 2. The left chart shows detection thresholds for glucose (blue). The right chart shows detection thresholds for sucralose (green). Each chart contains two bars. From left to right the bars are: 1) Detection threshold, 2) Detection threshold with 20mM NaCl added. 20mM NaCl was selected to match the concentration of glucose near threshold ~ 20mM. Thus, for each glucose molecule there would be a Na+ ion to be co-transported in theory. All treatments were paired with water rinses between stimuli. Twelve subjects participated in all conditions in duplicate. The error bars are standard error of the mean. * indicates significant difference, p < .0001.

