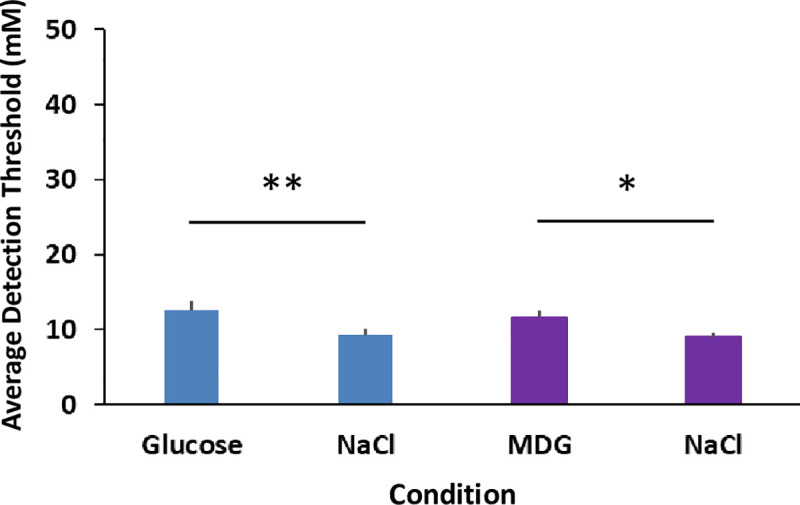
Fig 3. Comparison of detection thresholds for glucose and MDG with and without NaCl.

There are four bars in the chart. The first bar starting from the left shows the average detection threshold for glucose. The second bar shows the average detection threshold for glucose with the addition of 20 mM NaCl. The third bar shows the average detection threshold for MDG. The fourth bar on the right shows the average detection threshold for MDG with 20 mM NaCl. All treatments were paired with water rinses between stimuli. Eleven subjects participated in all conditions in duplicate. The error bars are standard errors of the mean. * indicates a significant difference p < .05; ** indicates a significant difference p < .01.
