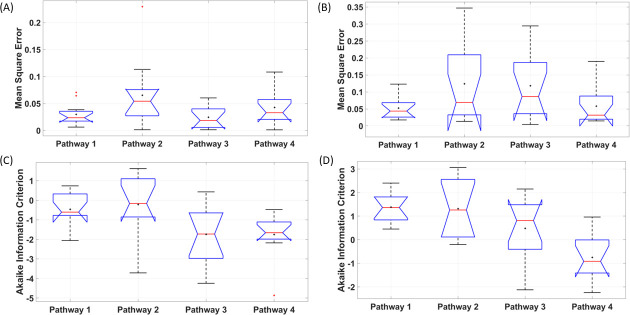
Fig 10. Boxplot across 11 subjects of the mean square error (MSE) and Akaike Information Criterion (AIC) of grey-box linear model fits for the four tDCS perturbation pathways.
Pathway 1: tDCS perturbing vessel response through synaptic potassium pathway, Pathway 2: tDCS perturbing vessel response through the astrocytic pathway, Pathway 3: tDCS perturbing vessel response through perivascular potassium pathway, and Pathway 4: tDCS perturbing vessel response through the SMC pathway. On each box, the central mark indicates the median, and the bottom and top edges of the box indicate the 25th and 75th percentiles, respectively. If the notches in the box plot do not overlap, one can conclude, with 95% confidence, that the true medians do differ. The whiskers extend to the most extreme data points not considered outliers, and the outliers are plotted individually using the red ’+’ symbol. The mean is also shown with a black ’+’ symbol. (A) MSE for targeted-region. (B) MSE for nontargeted-region. (C) AIC for targeted-region. (D) AIC for nontargeted-region.

