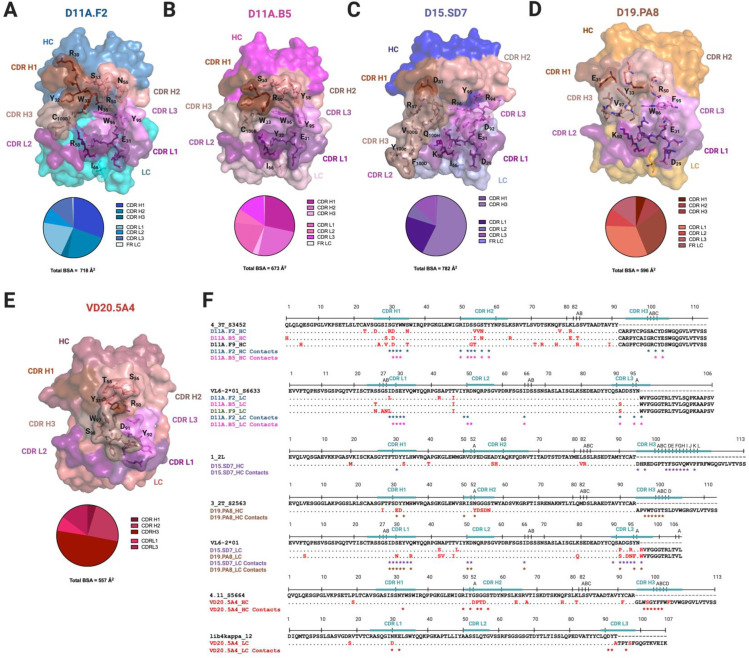
Fig 3. Structural characterization of mAbs elicited from vaccination.
Surface representations of (A) D11A.F2, (B) D11A.B5, (C) D15.SD7, (D) D19.PA8, and (E) VD20.5A4 Fabs. All mAbs are color coded as follows: CDR H1, chocolate; CDR H2, salmon; CDR H3, dark salmon; CDR L1, violet purple; CDR L2, deep purple and CDR L3, violet. The pie chart represents the relative contribution of each CDR loops to the total buried surface area of the paratope for each mAbs. (F) Sequence alignment of the mAbs to their germline genes with CDRs highlighted. Somatic hyper mutations (SHMs) are highlighted in red. Residues interacting with 16055 V2b peptide or 16055 V1V2 are shown as asterisks below the sequence (contact residues within 5 Å).

