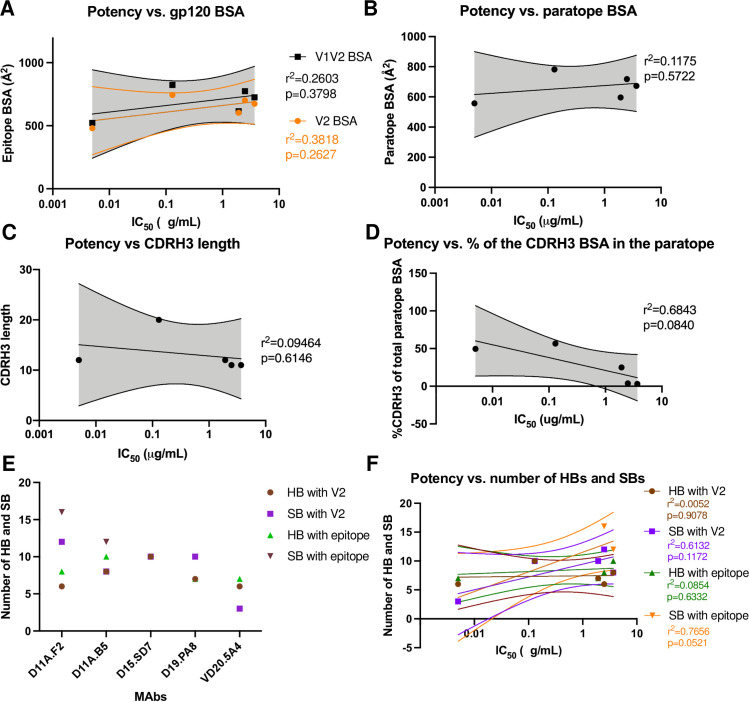
Fig 4. MAbs binding properties and correlations with autologous neutralization potency.
Correlation between autologous neutralization potency and (A) epitope surface area, (B) paratope surface area, (C) CDRH3 length, (D) relative contribution of the CDRH3 surface area in the paratope and (F) number of Hydrogen Bonds (HBs) and Salt Bridges (SBs). The lines indicate the fitted linear regression model with 95% confidence shown in shaded grey or color as indicated. The r2 and p values are displayed. (E) Graph indicates number of HBs and SBs between the epitope/paratope with the different mAbs.

