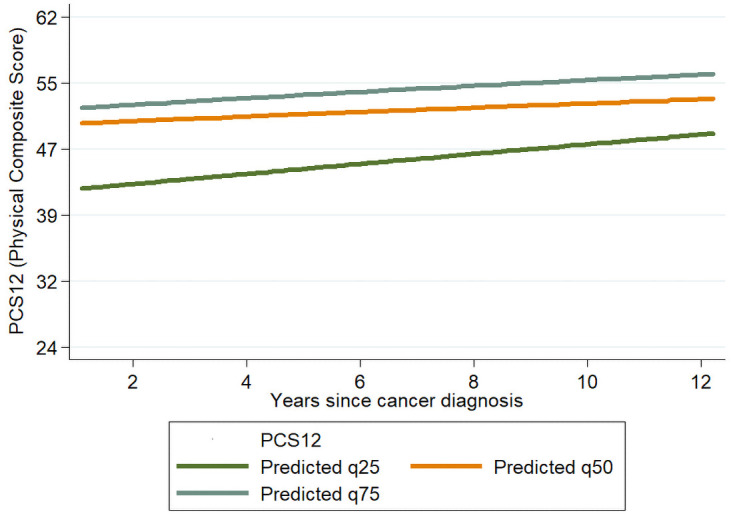
Fig 1. Scatterplot and line plot of predicted response for the 25th, 50th and 75th quantile for PCS in nonseminomas cases, on time between diagnosis and compilation of the questionnaire.

The lines refer to a subject with all categorical variables set at the reference values and aged 40 years at compilation of the questionnaire.
