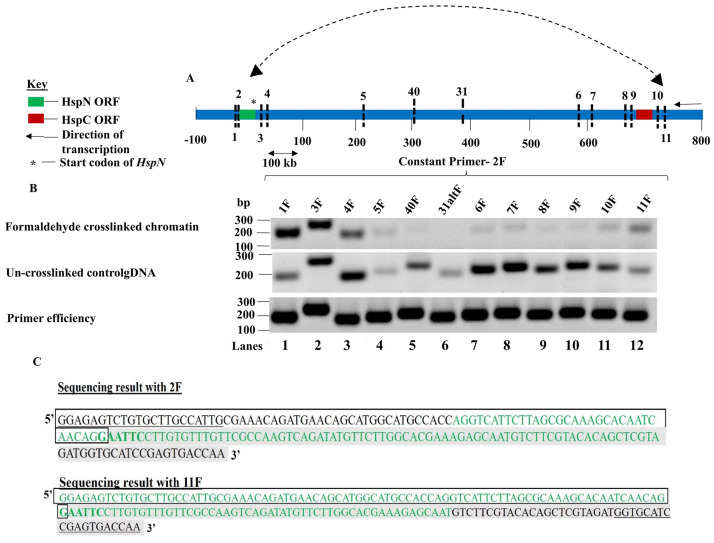
Fig 2. HspN and HspC ORFs physically interact in the nucleus.
A) Schematic representation of the relative positions of different EcoR1 loci in the vicinity and in between HspN and HspC ORFs on chromosome 5. B) First panel shows the PCR products obtained with constant primer 2F with other forward primers designed across the different loci in vicinity and in between HspN and HspC ORFs chosen for this study. Loci 1 and 3 which are in proximity to locus 2 show intense bands of corresponding sizes. As the distance from locus 2 increases, the PCR amplicons fade out and the PCR signal then starts picking up from locus 6 gradually; increasing significantly at locus 11 confirming physical proximity and interaction between loci 2 and loci 11 which are proximal to HspN and HspC ORFs respectively. Second panel shows the PCR products obtained with constant 2F primer with other forward primers corresponding to the different chosen loci for randomly ligated control gDNA. Third panel shows PCR amplicons of equal intensities with 2F constant primer and other forward primers indicating equal primer efficiencies. C) The enriched hybrid formed from locus 2 and locus 11 (Fig 2B, panel 1-lane 12) was excised and subjected to Sanger’s DNA sequencing with primers; 2F and 11F. Sequencing result with 2F as the primer could detect the presence of sequences from locus 2 and locus 11 which confirms the presence of this hybrid in the enriched band. Similarly, sequencing result with 11F as the primer could detect the presence of sequences from locus 11 and locus 2 which confirms the presence of the hybrid in the enriched band.

