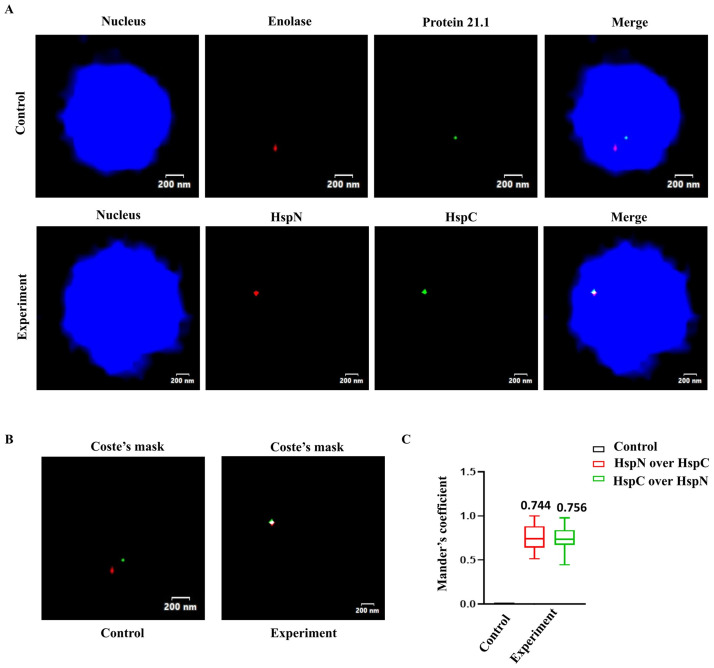
Fig 3. Fluorescence in situ hybridization shows co-localization of HspN and HspC ORFs within the nucleus.
A) Representative two-coloured FISH images showing localization of HspN and HspC loci. Top panel shows FISH using probes against Enolase (red) and Protein 21.1(green) which serves as a negative control for co-localization. Bottom panel represents co-localization of HspN (red) and HspC (green) loci. Multiple “Z stacks” were captured for every image in control as well as experiment and the resulting images were stacked to give the “merged” image. Genomic DNA was counterstained with DAPI (blue). B) Depicts the Coste’s mask (merge of green and red foci) for representative FISH images. Merged foci (white dot) as shown in experiment depicts true co-localization of the HspN and HspC loci. C) Quantitation of co-localization signal in Giardia nuclei. Box-and-whisker plots depicting Mander’s co-localization coefficient (range 0–1, where 0 signifies no co-localization and 1 signifies100% co-localization) as evaluated by JACoP plug-in of ImageJ software. A minimum of 30 cells were analysed for co-localization of red and green signals and plotted as the fraction of red overlapping green (red) and green overlapping red (green). Control refers to co-localization analysis performed with Enolase and Protein 21.1 probe.

