
Fig 4. Effect of C3G on autophagy in human islets exposed to amylin, Aβ1-42, H2O2 or rapamycin.
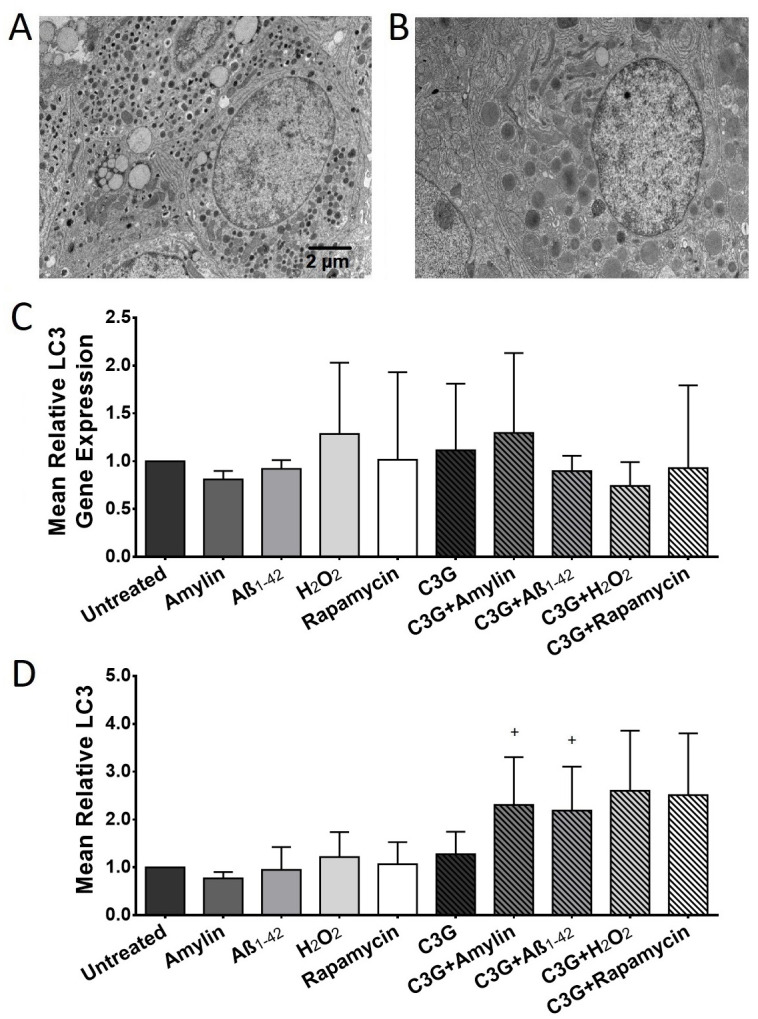
(A) Representative TEM image of a β cell in untreated and (B) C3G-treated islets. Scale bar represents 2μm. (C) Mean relative autophagic vesicle marker LC3 gene expression in untreated or C3G-treated human islets exposed to amylin or Aβ1-42 (n = 4). (D) Mean relative LC3 protein expression in untreated and C3G-treated human islets exposed to amylin or Aβ1-42 (+p<0.05, amylin vs. C3G + amylin; +p<0.01, Aβ1-42 vs. C3G + Aβ1-42; n = 3–5).