Figure 5.
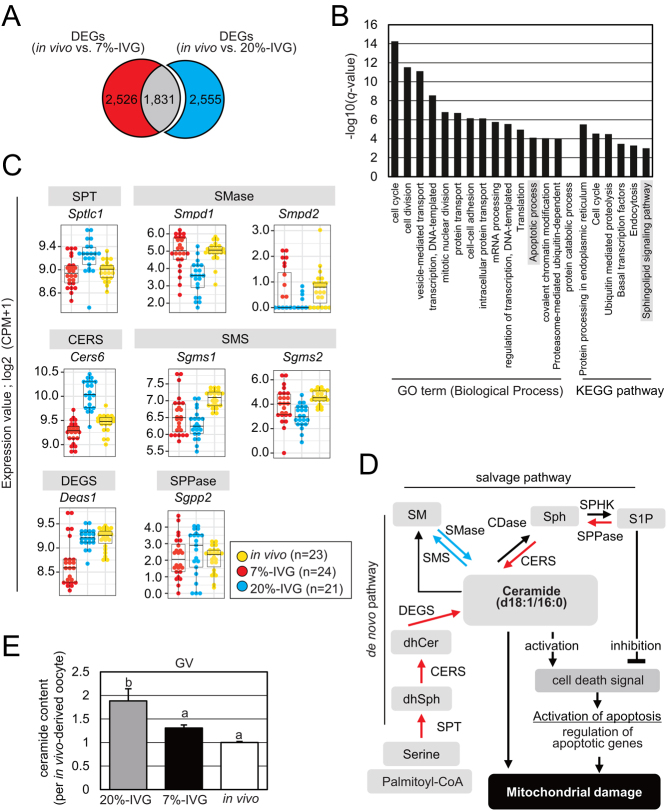
Identification of abnormal pathway specific to in vitro grown (IVG) oocytes under atmospheric O2 culture condition. (A) Venn diagram of 4357 differentially expressed genes (DEGs; red and gray; padj < 0.05) between 7%-IVG and in vivo-grown oocytes and 4386 DEGs (blue and gray; padj < 0.05) between 20%-IVG and in vivo-grown oocytes. A total of 2555 DEGs (blue) were specific to 20%-IVG oocytes. (B) Enrichment analysis of the 20%-IVG oocyte-specific 2555 DEGs (q-value < 0.05). Vertical axis indicates −log10(q-value value). (C) Expression of sphingolipid metabolic pathway genes included in the 2555 20%-IVG oocyte-specific DEGs. The dots indicate expression in in vivo-grown (yellow), 20%-IVG (blue), and 7%-IVG (red) oocytes. Vertical axis indicates log2(CPM+1). SPT, serine palmitoyltransferase; SMase, sphingomyelinase; CERS, ceramide synthase; SMS, Sphingomyelin synthase; DEGS, dihydroceramide desaturase; SPPase, sphingosine-1-phosphate phosphatases. (D) A schematic diagram of the sphingolipid metabolic pathway consisting of the de novo and the salvage pathways. Red and blue arrows indicate significantly upregulated and downregulated gene expression, respectively, in 20%-IVG oocytes. dhSph, dihydrosphingosine; dhCer, dihydroceramide; Sph, sphingosine; S1P, sphingosine-1-phosphate; CDase, ceramidase; SPHK, sphingosine kinase. (E) C16-ceramide content in in vivo-grown, 20%-IVG, and 7%-IVG oocytes. Ceramide quantity in 20%-IVG and 7%-IVG oocytes relative to that in in vivo-grown oocyte. Error bars indicate s.d. Different letters represent significant difference (Tukey–Kramer test, P < 0.05).

 This work is licensed under a