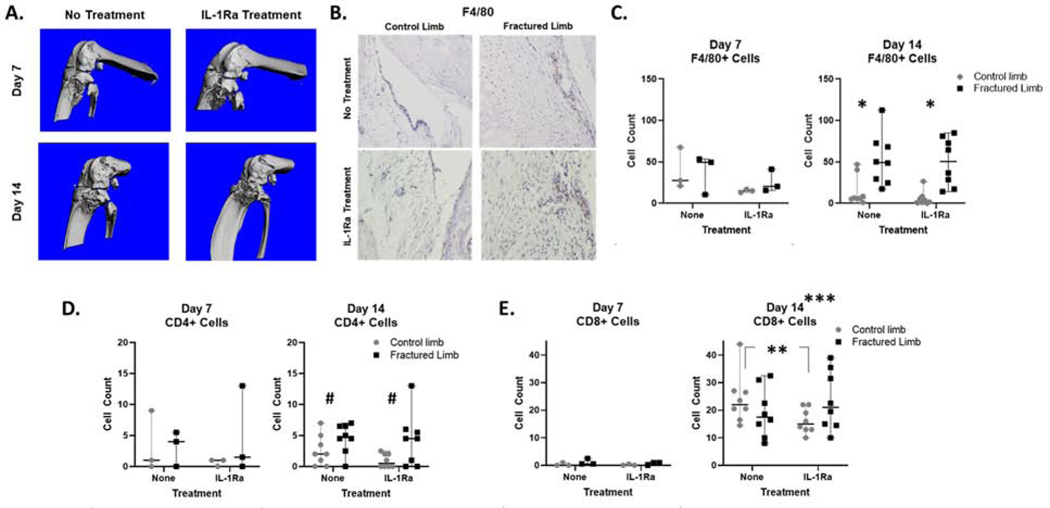
Figure 4.
Closed articular fracture in the mouse knee and quantification of immune cells in mouse synovial tissue following fracture. A) MicroCT images of fractured knee joints for both no treatment and IL-1Ra treatment at Day 7 and Day 14 post-fracture. B) Representative images of positive IHC staining in synovium at Day 14 in contralateral control and fractured limbs (brown=F4/80+ stain, blue=hematoxylin counter stain). C) Quantification of macrophages via F4/80+ cells in synovial tissue via IHC staining (Day 14, control vs fractured limb *p≤0.017). D) Quantification of CD4+ T cells in synovial tissue via IHC staining (Day 14, control vs fractured limb #p=0.063). E) Quantification of CD8+ T cells in synovial tissue via IHC staining (Day 14 control limb, no treatment vs IL-1Ra **p=0.031; for both limbs in both groups, Day 14 vs Day 7 ***p≤0.019).

