
FIGURE 2.
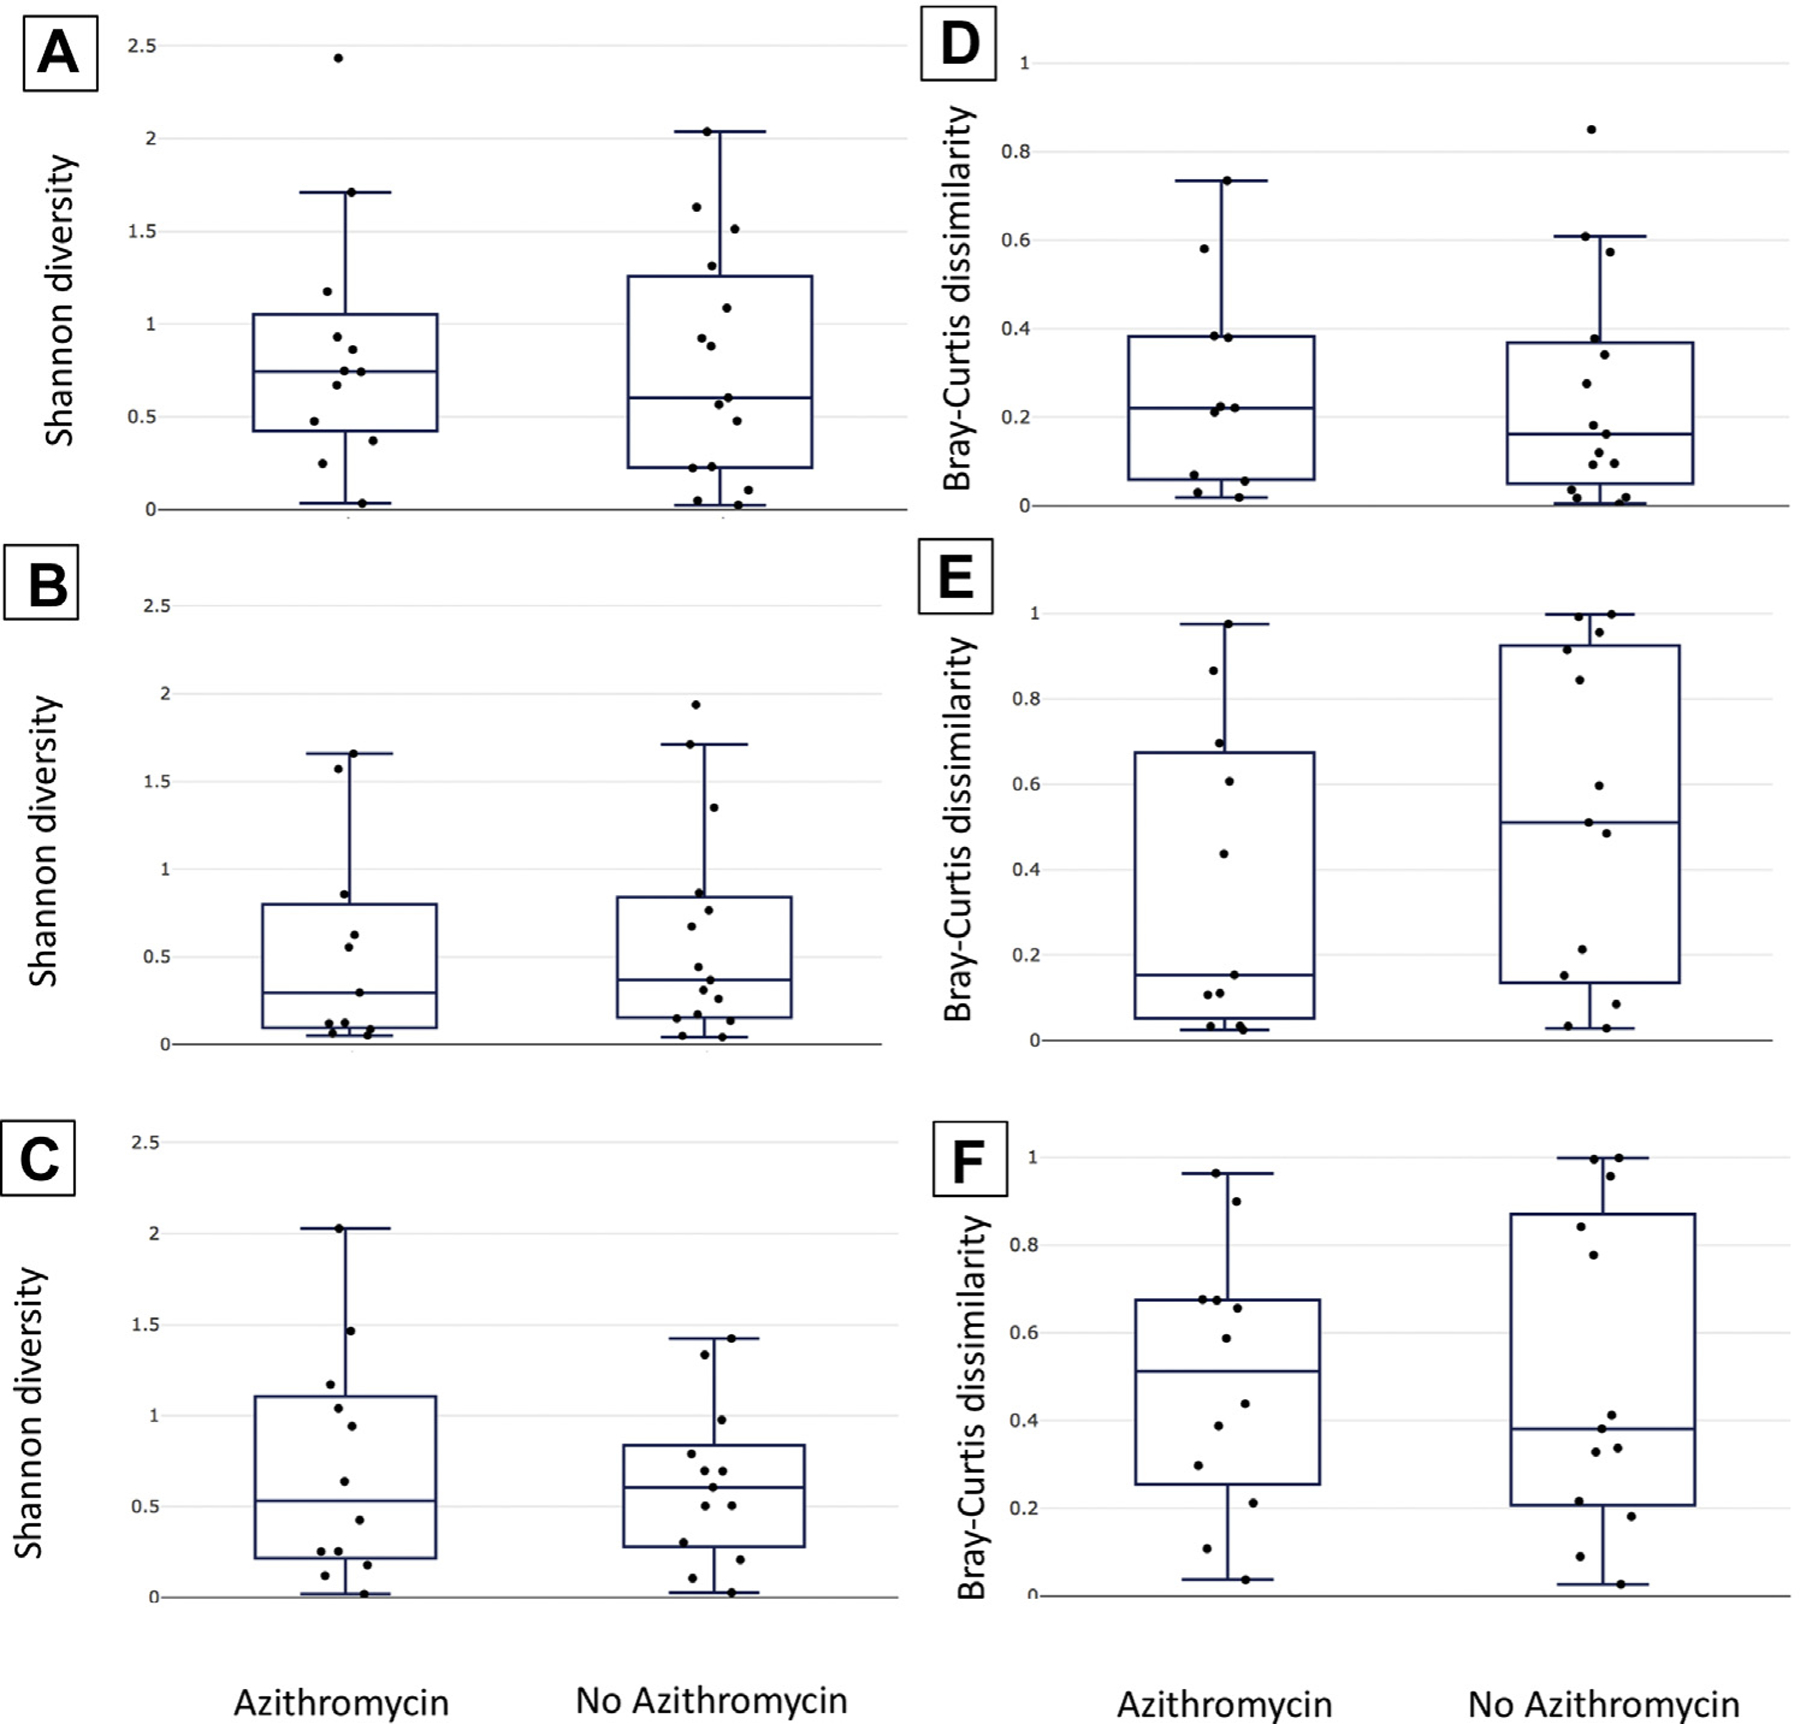
Alpha diversity and community stability were not associated with azithromycin treatment. Shannon diversity (A–C) and Bray-Curtis dissimilarity (D–F) are plotted using box and whisker plots to compare the azithromycin and no-azithromycin groups. The median is indicated by a horizontal line, quartiles by boxes, and minimum and maximum by whiskers. Shannon diversities are shown for samples collected at the time of enrollment (panel A), egg retrieval (panel B), and embryo transfer (panel C). Bray-Curtis dissimilarities (representing the degree of change in community structure) are shown for the time period between enrollment and egg retrieval (D), egg retrieval and embryo transfer (E), and enrollment and embryo transfer (F).