Figure 6.
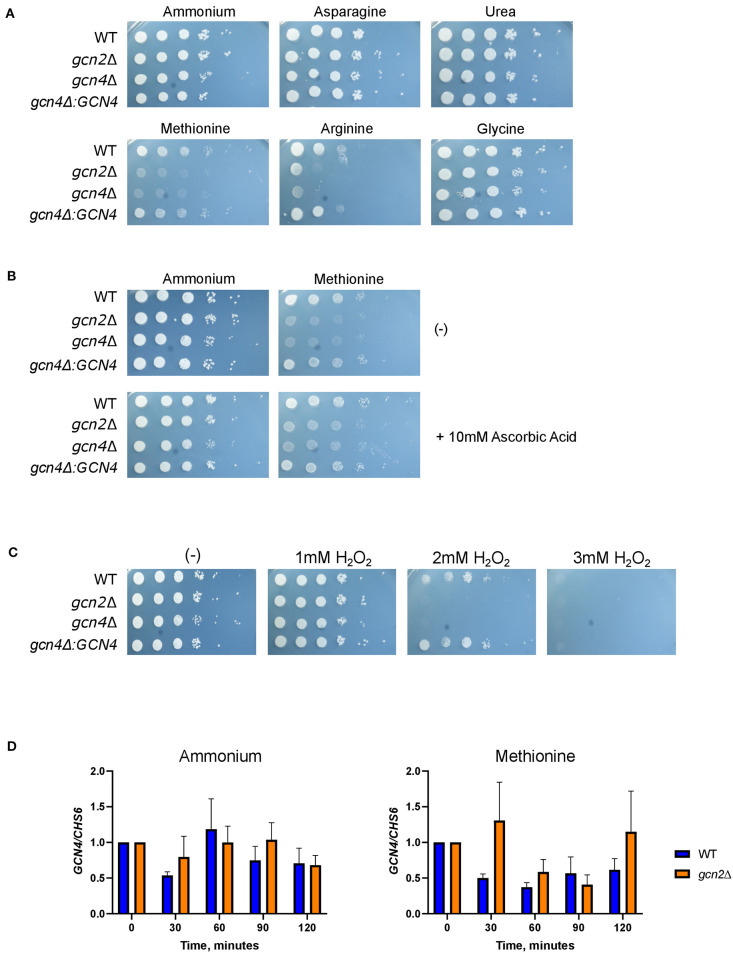
Gcn4 connects methionine metabolism and oxidative stress in C. neoformans. (A) Serial dilution analysis of wild-type, gcn2Δ, and gcn4Δ cells. Cells were spotted on YNB agar plates supplemented with 2% dextrose and 10 mM of the indicated compound as the sole nitrogen source. Plates were incubated at 30° for 2 days before imaging. Images shown are representative of three biological replicates. (B) Serial dilution plate analysis of antioxidants combined with methionine. Wild-type, gcn2Δ, and gcn4Δ serial dilutions were spotted onto agar plates containing YNB, 2% dextrose, 10 mM of either ammonium sulfate or methionine, with or without the addition of 10 mM ascorbic acid. Plates were incubated at 30° for 2 days before imaging. Image shown are representative of three biological replicates. (C) Serial dilution plate analysis of peroxide sensitivity. Wild-type, gcn2Δ, and gcn4Δ serial dilutions were spotted onto agar plates containing YNB, 2% dextrose, 10 mM ammonium sulfate, and the indicated concentration of hydrogen peroxide. Plates were incubated at 30° for 2 days before imaging. Images shown are representative of three biological replicates. (D) RT-qPCR analysis of steady-state abundance of the GCN4 transcript in ammonium or methionine. Mid-log wild-type or gcn2Δ cells were resuspended in fresh ammonium or methionine media for incubation during a 2-h time course. Cells were harvested in 30-min increments. Total RNA extracted from cells was used to synthesize cDNA for qPCR analysis. GCN4 abundance was normalized to CHS6 abundance. Data shown are from three biological replicates.

