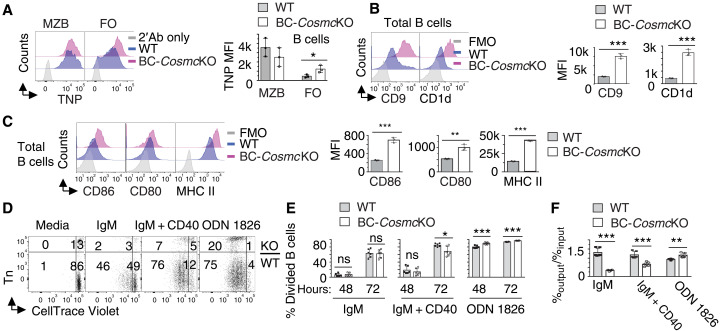
Fig. 3. Hyperresponsiveness of Cosmc-deficient B cells.
(A) Representative histogram plots of TNP-Ficoll antigen binding on WT and Cosmc-deficient B cells. Right: Mean fluorescence intensity (MFI) of anti-TNP antibody on B cells shown for each WT and BC-CosmcKO mouse. Enhanced expression of CD9 and CD1d (B) and CD86, CD80, and MHC II (C) on Cosmc-deficient B cells. Right: MFI of indicated molecules on B cells is shown. FMO, fluorescence minus one control. For (A) to (C), results are representative of three independent experiments with at least three animals in each group. Splenocytes were prepared from both BC-CosmcKO and WT littermate controls. (D) Representative fluorescence-activated cell sorting (FACS) analysis of splenocyte coculture system at day 3. FACS plots are from a gated CD19+ population. Mixed splenocytes from both BC-CosmcKO and WT littermate controls were labeled with CellTrace Violet and cultured in the same well in the presence of indicated stimuli. BC-CosmcKO B cells were stained positive with anti-Tn antibody. CellTrace dilution indicates cell division. Quantification of divided cells of BC-CosmcKO (Tn+) or WT (Tn−) B cells is shown (E). Cell viability measured by the ratio of [percentage of dye+ Tn− or Tn+ B cells]output/[total B cells]output to that of input and quantified (F). Results are from three independent experiments. Each symbol (black square, WT; open circle, BC-CosmcKO) represents an individual mouse, graphed as means ± 1 SEM. Young (2 to 4 months old) male mice were used in (A) to (F). Unpaired two-tailed Student’s t tests were performed to determine statistical significance, *P < 0.05, **P < 0.01, and ***P < 0.001.

