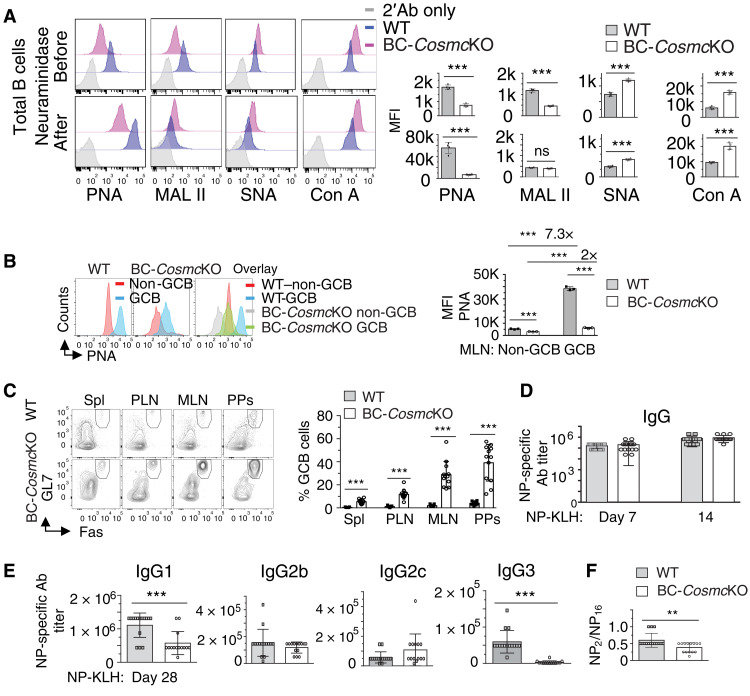
Fig. 4. Enhanced spontaneous GCB cells in BC-CosmcKO mice.
Binding analysis of biotinylated lectins PNA, MAL II, SNA, and Con A, followed by streptavidin–Alexa Fluor 488, on neuraminidase- or PBS-treated WT and BC-CosmcKO splenic B cells (A). PNA binding of GCB cells (B220+ or CD19+ GL7+ Fas+) and non-GCB cells (B220+ or CD19+ GL7− Fas−) (B). Right: MFI of lectin binding on indicated B cell population is shown for each WT and BC-CosmcKO mouse in (A) and (B). (C) Representative FACS plots of GCB cells in BC-CosmcKO mice in indicated tissues. Right: Percentage of GCB cells of total B cells is shown for each WT and BC-CosmcKO mouse. (D and E) NP-specific immunoglobulin responses to immunization with NP-KLH. (F) Ratio of NP-specific high-affinity IgG to total NP-specific IgG was from two experiments with similar results. In (D), n = 15 for both WT and BC-CosmcKO mice. In (E) and (F), n = 15 for both WT and n = 14 for BC-CosmcKO mice at day 28. Representative plots from both WT and BC-CosmcKO mice are shown in (A) to (C). Each symbol (black square, WT; open circle, BC-CosmcKO) represents an individual mouse, graphed as means ± 1 SEM. Young (2 to 4 months old) male mice were used in (A) to (F). Unpaired two-tailed Student’s t tests were performed to determine statistical significance, **P < 0.01 and ***P < 0.001.

