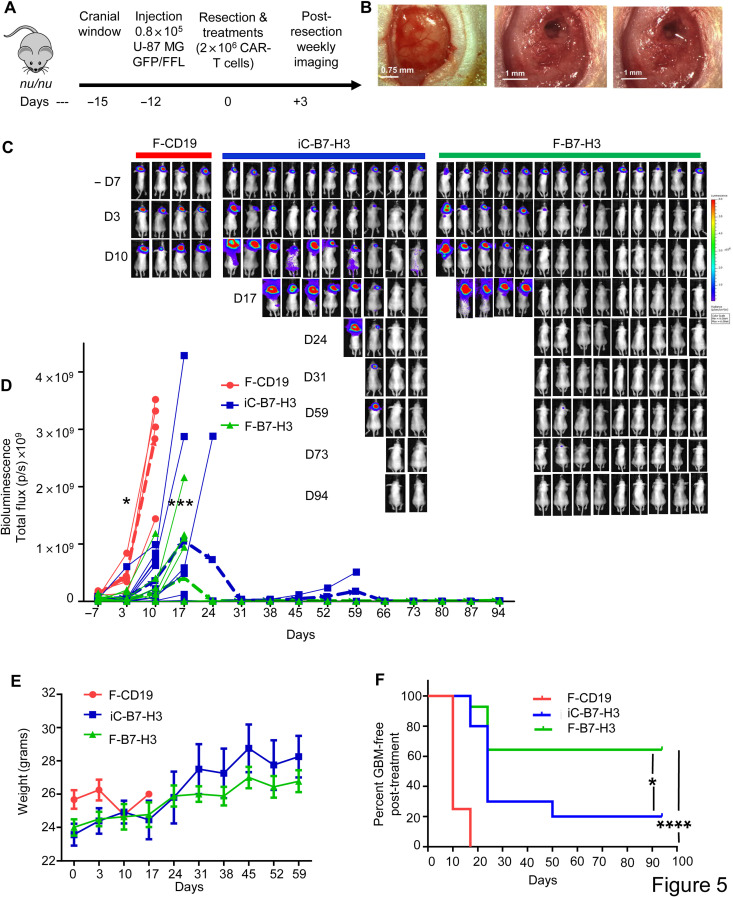
Fig. 5. CAR-T cells delivered via fibrin gel control GBM tumor growth after partial resection.
(A) Schematic of the xenograft GBM model in which the tumor mass is partially resected and mice are treated with CAR-T cells inoculated via direct intracavity injection (iC-B7-H3) or by in situ formation of the fibrin gel (F-B7-H3). Control mice received CD19 CAR-T cells encapsulated in the fibrin gel (F-CD19). (B) Representative images showing tumor before resection (left panel), after surgery (middle panel), and after fibrin gel formed in situ in the tumor resection cavity (right panel). Scale bar, 0.75 mm - 1 mm. (C) Representative tumor BLI images showing tumor growth in F-CD19–, iC-B7-H3–, and F-B7-H3–treated mice. (D) Tumor BLI kinetics in F-CD19–, iC-B7-H3–, and F-B7-H3–treated mice (4 to 15 mice per group). *P = 0.0296 and 0.0.471 for day –7 and day 3 versus day 17 in iC-B7-H3 versus F-B7-H3, (blue bold dotted line and green bold dotted line, indicating the averages respectively), determined by Turkey’s multiple comparison test; ***P = 0.0009 as overall function calculated by two-way ANOVA. (E) Quantification of mouse weight in the experimental groups described in (B). (F) Kaplan-Meier survival curve of the treated mice as described in (C). *P = 0.0259 (iC-B7-H3 versus F-B7-H3); ****P < 0.0001 (F-CD19 versus F-B7-H3), χ2 test. For the survival curve, mice were censored when the BLI signal reached 1 × 10⁹ photons per second. Photo credit: E. A. Ogunnaike, University of North Carolina, Chapel Hill.

