
Figure 5:
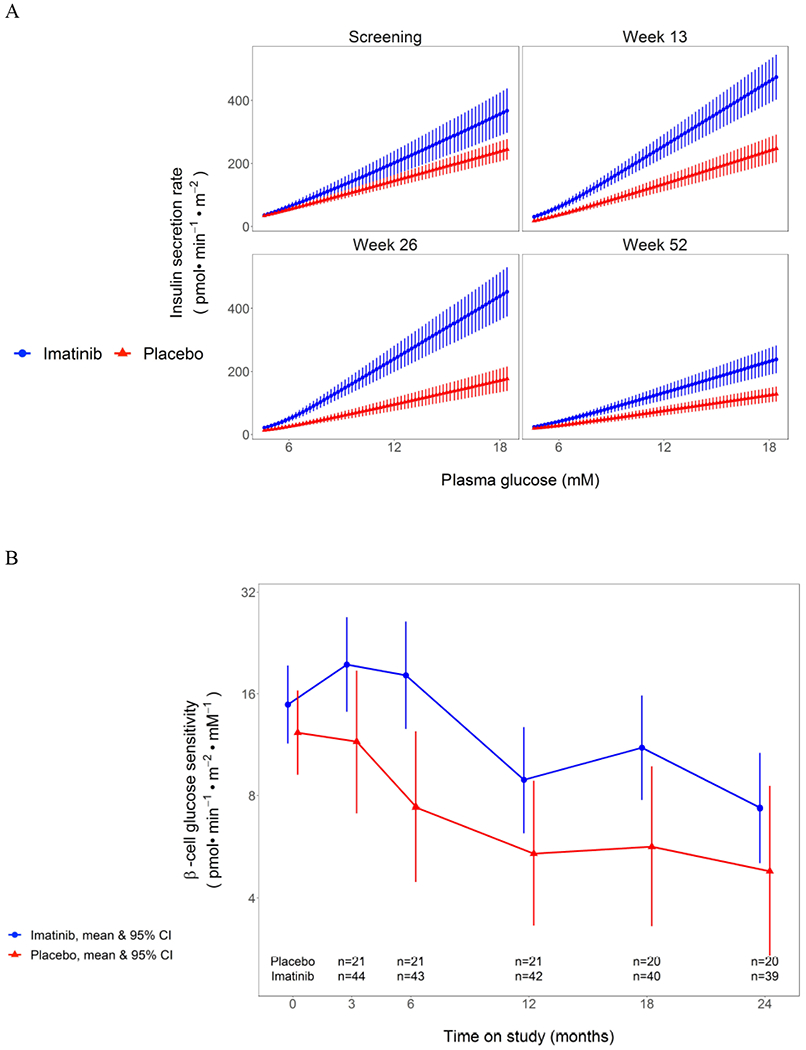
A) Dose-response curve of insulin secretion rates versus plasma glucose levels during the serial MMTTs in imatinib versus placebo groups. Data are mean with SEM. The mean slope of the dose response is beta-cell glucose sensitivity, presented in B) as change in beta cell glucose sensitivity over time in imatinib versus placebo study groups. Plots are means with 95% CI.