. 2021 Oct 6;10:e70408. doi: 10.7554/eLife.70408

Figure 3. Ca2+ uncaging dose-response curve measured with deconvolution of EPSCs.

(A) Illustration of the cellular connectivity in the cerebellar cortex showing the pre- and postsynaptic compartments during paired whole-cell patch-clamp recordings and Ca2+ uncaging with UV-illumination. (B) Two-photon microscopic image of a cMFB and a GC in the paired whole-cell patch-clamp configuration. (C) Three different recordings showing UV-flash evoked EPSC (top trace) and cumulative release rate measured by deconvolution analysis of the EPSCs (bottom trace). The peak Ca2+ concentration, quantified with two-photon Ca2+ imaging, is indicated in each panel. τ represents the time constant from mono-exponential fit, τ1 represents the time constant of the fast component of bi-exponential fit. Note the different lengths of the baselines in the three recordings. (D) Plot of release rate versus post-flash Ca2+ concentration. Gray open circles represent data from capacitance measurements (Figure 2) and black triangles represent data from deconvolution analysis of EPSC (n = 57 recordings obtained from 42 paired cells). Gray and black lines represent fits with a Hill equation of the capacitance (as shown in Figure 1F) and the deconvolution data, respectively. The best-fit parameters for the fit on the deconvolution data were Vmax = 6*107 ms−1, KD = 7.6*105 µM, and n = 1.6. Red, blue, and brown symbols correspond to the traces in (C). (E) Plot of synaptic delay versus post-flash Ca2+ concentration (n = 59 recordings obtained from 43 paired cells). Note that two recordings was removed from the analysis because the exponential fit led to a negative value of the delay Gray open circles represent data from capacitance measurements, and black triangles represent data from deconvolution analysis of EPSC. Red, blue, and brown symbols correspond to the traces in (C).
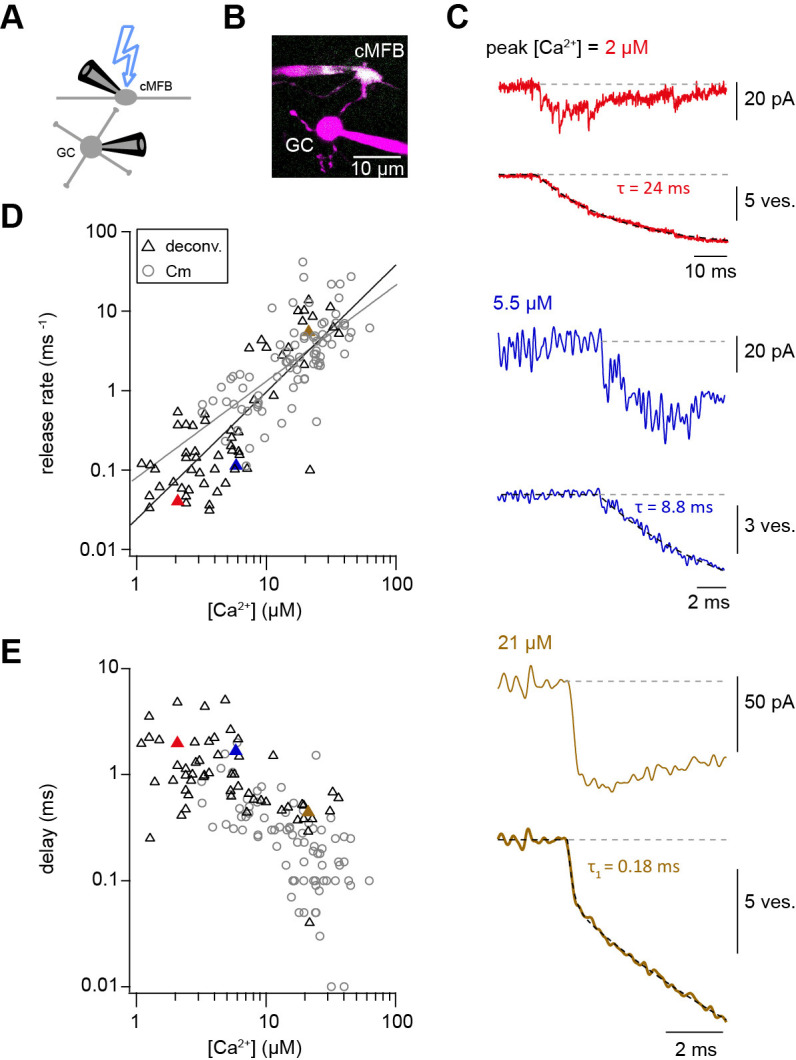
Figure 3—source data 1. Ca2+ uncaging dose-response curve measured with deconvolution of EPSCs.

Figure 3.

Figure 3—figure supplement 1. Measuring the KD of the Ca2+ sensitive dyes.

Figure 3—figure supplement 1.

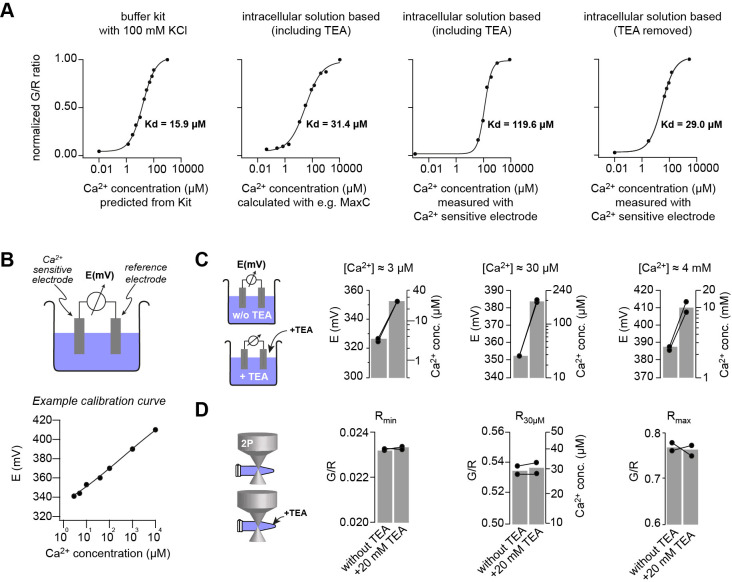
(A) Green (OGB-5N) over red (Atto594) fluorescence ratio for different Ca2+ concentrations, measured using either a Ca2+ calibration buffered kit or by clamping the free Ca2+ using EGTA in the intracellular patching solution. The free Ca2+ concentration was predicted from the kit, calculated with software like Maxchelator (MaxC) or measured by potentiometry using a Ca2+-sensitive electrode. The indicated KD values were obtained from superimposed fits with Hill equations. (B) Top: illustration of the Ca2+-sensitive electrode. Bottom: Example of a calibration curve of the Ca2+-sensitive electrode fitted with a straight line. (C) Effect of Tetraethylammonium (TEA) on the Ca2+-sensitive electrode at different Ca2+ concentrations. 20 mM TEA induced ~10-fold increase in the potential (left axis) and thus the read-out Ca2+ concentration (right axis) of intracellular solutions which had free Ca2+ concentrations clamped by EGTA to 3 μM, 30 μM, or 4 mM (pH was kept constant; bargraphs represent the mean; line-connected circles represent two independent repetitions). (D) Effect of TEA on G/R fluorescence ratio. The ratio of the intracellular solution containing only 10 mM EGTA (Rmin), free Ca2+ clamped with EGTA to 30 μM (R30μM), or 10 mM Ca2+ (Rmax) did not change upon adding 20 mM TEA indicating that TEA is not contaminated with Ca2+ but instead TEA specifically interferes with the Ca2+-sensitive electrode.
Figure 3—figure supplement 2. Comparison of brief versus long UV illumination to rule out fast Ca2+ overshoots.
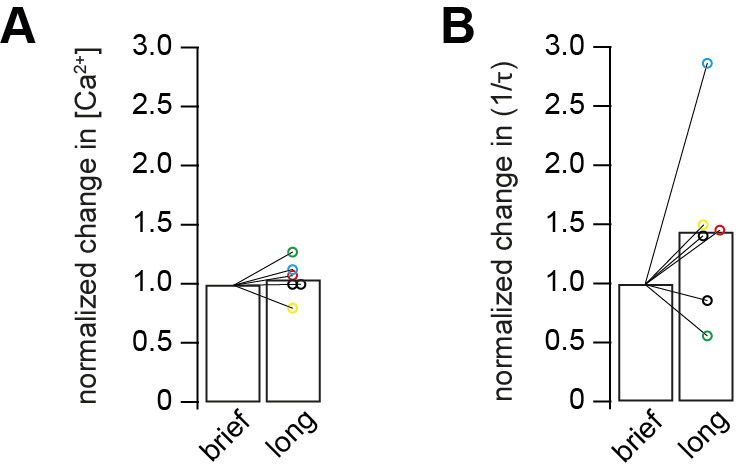
Figure 3—figure supplement 2.

(A) Post-flash Ca2+ concentration obtained from long flashes of 1 ms duration and 10% UV intensity, normalized to post-flash Ca2+ concentration obtained from brief flashes of 0.1 ms duration and 100% UV intensity. Two consecutive weak flashes (brief and long) were applied on each cell (n = 6 paired cells). (B) Release rates obtained from long flashes of 1 ms duration and 10% UV intensity, normalized to release rates obtained from brief flashes of 0.1 ms duration and 100% UV intensity. Color code matches the data in A and B. Two consecutive weak flashes (brief and long) were applied on each cell (n = 6 paired cells).
Figure 3—figure supplement 3. Correction for the post-flash changes in the fluorescent properties of the intracellular solution.

Figure 3—figure supplement 3.

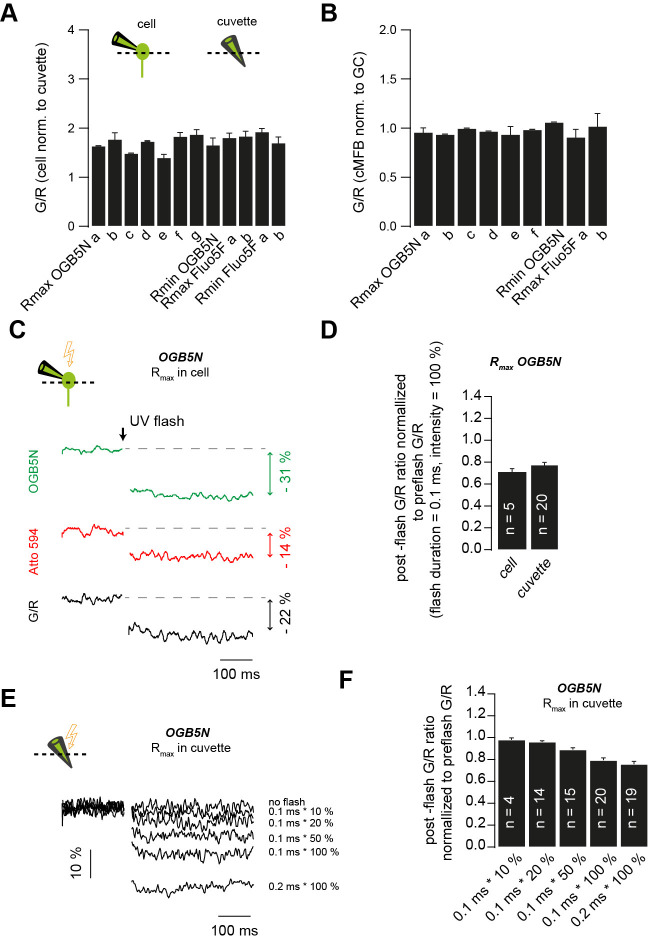
(A) Green over red fluorescence (G/R) ratios measured in situ normalized to G/R ratios measured in cuvettes. Data represent the different solutions used throughout the study. (a–g) represent measurements obtained from different solutions prepared using different pre-stocks of the fluorescent indicators or a different DMn/Ca2+ concentration. (B) Green over red fluorescence (G/R) ratios measured in cMFBs normalized to G/R ratios measured in GCs. Data represent different solutions used throughout the study. (a–f) represent measurements obtained from different solutions prepared using different pre-stocks of the fluorescent indicators or a different DMn/Ca2+ concentration. (C) Example traces of in situ post-flash alterations in the green fluorescence, in the red fluorescence, and the overall drop in the G/R ratio (in black) in response to a UV flash of 0.1 ms duration and 100% intensity. (D) Comparison of the UV-flash-induced bleaching of fluorescent indicators measured in cells to the UV-flash-induced bleaching of fluorescent indicators measured in cuvettes, in response to a UV flash of 0.1 ms duration and 100% intensity. (E) Example traces of UV-flash-induced changes occurring in cuvettes in response to UV flashes of different intensities or duration. (F) Average UV-flash-induced changes occurring in cuvettes in response to UV flashes of different intensities or duration.
Figure 3—figure supplement 4. Comparison of the time constants obtained from presynaptic capacitance measurements (τCm) and analysis of postsynaptic current recordings (τdeconv).
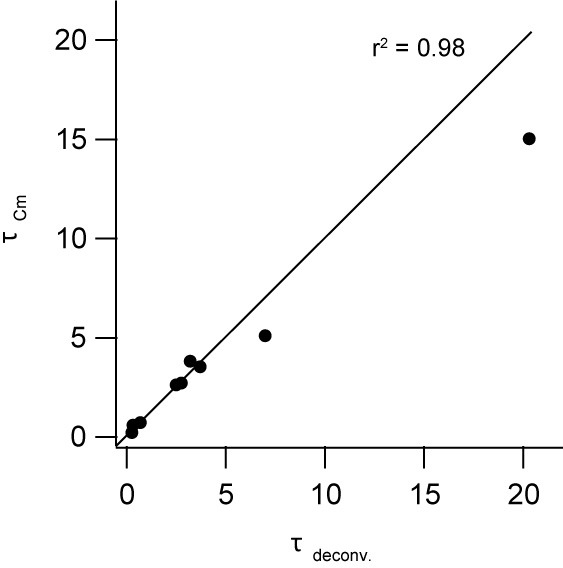
Figure 3—figure supplement 4.

The time constants were obtained from the initial fast component of exponential fits of the capacitance trace and the cumulative release trace obtained from the deconvolution analysis of the simultaneously recorded postsynaptic current. The line represents the identity relation (r2 = 0.98; n = 9 paired cMFB-GC recordings).