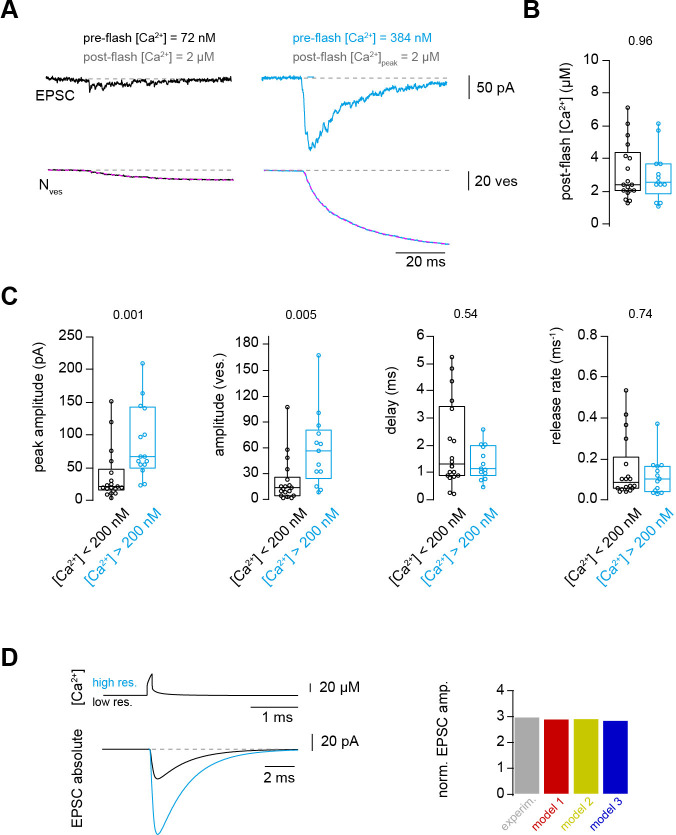
Figure 7. Ca2+ uncaging with different pre-flash Ca2+ concentrations indicates Ca2+-dependent vesicle priming.
(A) Two consecutive recordings from the same cell pair, with the same post-flash Ca2+ concentration but different pre-flash Ca2+ concentration in the presynaptic terminal. Top: postsynaptic current. Bottom: cumulative release of synaptic vesicles measured by deconvolution analysis of EPSCs superposed with a mono-exponential fit (magenta). Black and blue color represent low and high pre-flash Ca2+ concentration, respectively. The pre- and post-flash Ca2+ concentrations are indicated in each panel. (B) Comparison of the average post-flash Ca2+ concentration between both groups of either low (black) or high (blue) pre-flash Ca2+ concentration (n = 18 and 13 pairs, respectively). (C) From left to right: comparisons of the peak amplitude, the number of released vesicles measured as obtained from deconvolution analysis of EPSC, the delay of the release onset, and the release rate. Boxplots show median and 1st/3rd quartiles with whiskers indicating the whole data range. The values above the boxplots represent P-values of Mann-Whitney U tests. (D)Top left: simulated local action potential-evoked Ca2+concentrations at 20 nm from a Ca2+ channel taken from Delvendahl et al., 2015. Note the almost complete overlap of the two Ca2+ concertation traces with low and high basal Ca2+ concertation. Bottom left: predicted action potential-evoked EPSCs with low and high basal Ca2+ concertations. Right: ratio of the action potential-evoked EPSC amplitude with high and low basal Ca2+ concentrations for the experimental data and the model predictions.

