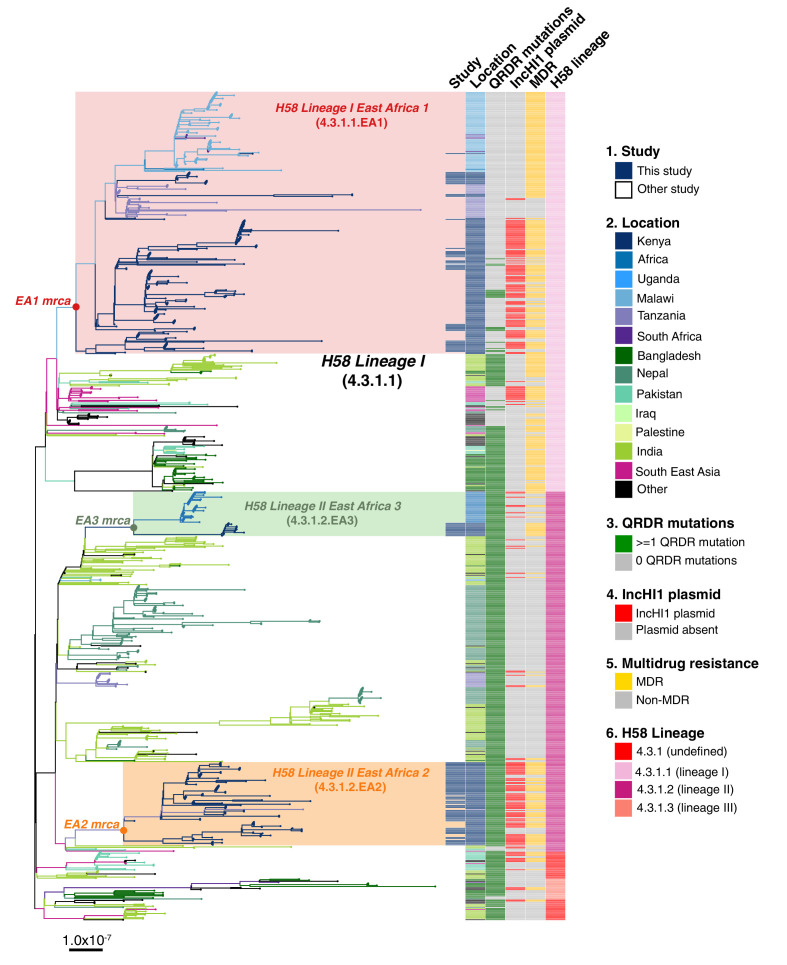
Figure 2. Global population structure of H58 (4.3.1) S.Typhi showing Kenyan isolates cluster into three East African clades.
Whole genome phylogeny of 1,204 H58 isolates, including all available Kenyan genomes (n = 128 from this study, n=111 from prior studies) and globally distributed genomes for context (n=965, see Methods). Branch lengths are in substitutions per core-genome site, branches are coloured to indicate geographical origin (see inset legend), shaded boxes highlight the three East African H58 clades defined in this study. Colour bars to the right indicate (as per inset legend): 1, Kenyan strains isolated and sequenced during this study; 2, geographical location; 3, mutation(s) in the quinolone resistance determining region (QRDR) of genes gyrA, gyrB, and parC; 4, presence of multidrug resistance (MDR) IncHI1 plasmid; 5, presence of MDR genes; 6, H58 lineage. Interactive version available at https://microreactorg/project/wViqmaRdZuFVEb6yk4i1jU.


