. 2021 Sep 13;10:e67852. doi: 10.7554/eLife.67852

Figure 4. Temporal distribution of genotypes and among all cases and carriers.

(A) Dated maximum-clade credibility phylogenetic tree of Kenyan S. Typhi genotype 4.3.1 (H58), including 128 isolated from this study. Tip colours & first colour bar indicate symptom status, second colour bar indicates those isolates from children living in the defined survey area. Black triangles demarcate nodes of interest, and the accompanying bars indicate 95% HPD of node heights. Interactive phylogeny available at https://microreactorg/project/I2KUoasUB. (B) Distribution of terminal branch lengths for all sequences, extracted from the Bayesian tree shown in (A). (C) Distribution of isolate-specific SNPs detected in sequences from all cases and controls. (D) Distribution of terminal non-synonymous mutations detected in sequences from all cases and controls. In the boxplots in panels B, C, and D, black bars indicate median values, boxes indicate interquartile range. Cases and carrier samples indicated as per the inset legend.

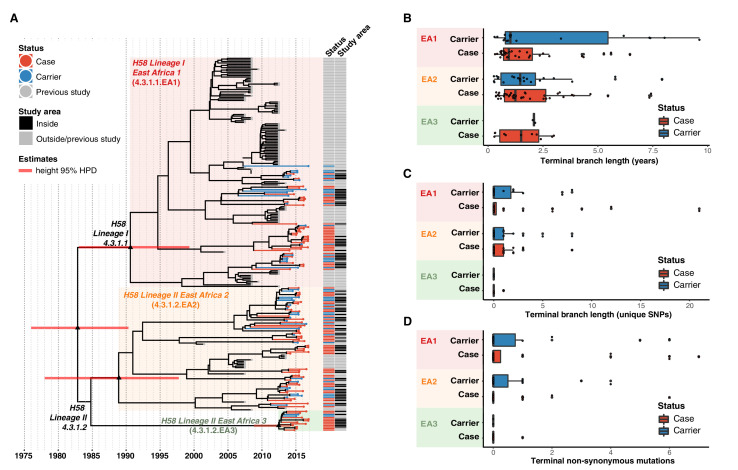
Figure 4.

Figure 4—figure supplement 1. Spatial distribution of S. Typhi genotypes throughout the informal settlement.

Figure 4—figure supplement 1.

Each individual point represents an individual S. Typhi isolate obtained from the informal settlement which are coloured by genotype as per the inset legend.
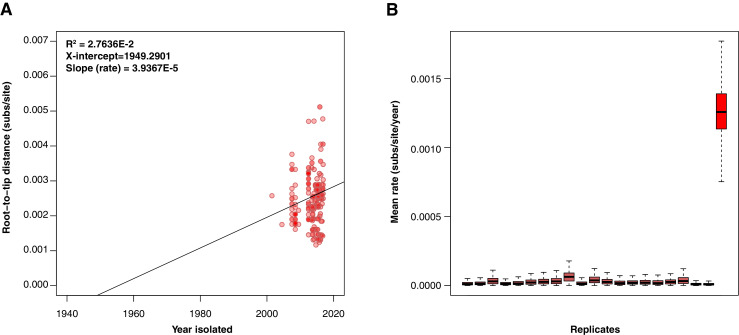
Figure 4—figure supplement 2. Tempest regressions & BEAST date randomisation testing.

Figure 4—figure supplement 2.

(A) Kenyan H58 S. Typhi tempest regression of root-to-tip distance as a function of sampling time, with the root of the tree selected using heuristic residual mean squared (each point represents a tip of the maximum likelihood tree). The slope is a crude estimate of the substitution rate for the SNP alignment, the x-intercept corresponds to the age of the root node, and the R2 is a measure of clocklike behaviour (B) Kenyan H58 S. Typhi date randomisation test with the right most box plot showing the posterior substitution rate estimate from the SNP alignment of the data with the correct sampling times, and the remaining 20 boxplots showing the posterior distributions of the rate from replicate runs using randomised dates. The data are considered to have strong temporal signal if the estimate with the correct sampling times does not overlap with those from the randomisations.
Figure 4—figure supplement 3. Temporal and age distribution of genotypes among cases and controls inside the survey site.

Figure 4—figure supplement 3.

(A) Dated maximum-clade credibility phylogenetic tree of Kenyan S. Typhi genotype 4.3.1 (H58), including 128 isolated from this study. Tip colours and first colour bar indicate symptom status, second colour bar indicates those isolates from children living in the defined survey area. Black triangles demarcate nodes of interest, and the accompanying bars indicate 95% HPD of node heights. Interactive phylogeny available at https://microreactorg/project/I2KUoasUB. (B) Distribution of terminal branch lengths for sequences isolated from cases and controls within the survey area, extracted from the Bayesian tree shown in (A). (C) Distribution of isolate-specific SNPs detected in sequences from cases and controls resident the survey area. (D) Distribution of terminal non-synonymous mutations detected in sequences from cases and controls within the survey area. In the boxplots in panels B, C, and D, black bars indicate median values, boxes indicate interquartile range.